WTI Price Analysis: Bears approach monthly support near $84.40
- WTI holds lower ground after breaking 50-DMA support.
- Steady RSI keeps sellers hopeful to visit the short-term key support trend line.
- Buyers need validation from a three-month-old resistance line to retake control.
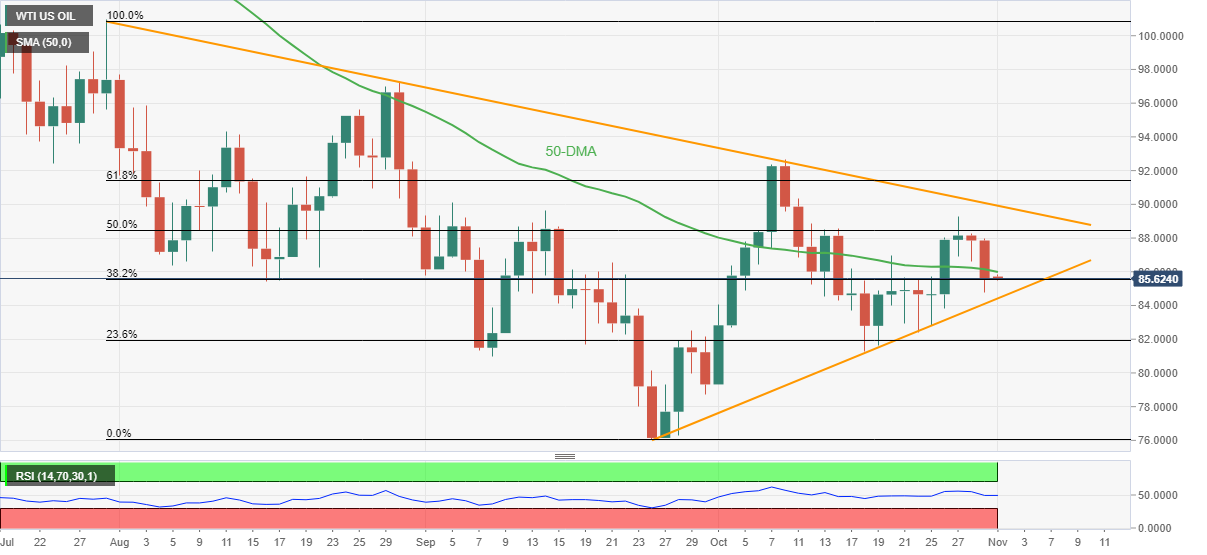
WTI crude oil prices print three-day downtrend as it drops to 85.55 during Tuesday’s Asian session. In doing so, the black gold justifies the previous day’s downside break of the 50-DMA.
That said, the steady RSI (14) adds strength to the bearish bias suggesting the quote’s further downside towards an upward sloping support line from September 26, around $84.40 at the latest.
In a case where the energy benchmark breaks the $84.40 key support, the odds of witnessing its slump towards the lows marked on October 18 and September 08, respectively around $81.30 and $80.95, can’t be ruled out.
However, the commodity’s downside past $80.95 appears difficult as the $79.30 level could challenge the sellers before directing them to September’s bottom around $78.00.
Alternatively, the 50-DMA hurdle surrounding $86.00 restricts the WTI crude oil’s immediate recovery before the previous week’s high of $89.30.
Following that, a downward-sloping resistance line from late July, around $89.90 and the $90.00 threshold could challenge the commodity buyers.
Should the quote manage to remain firmer past $90.00, it could rush towards the previous monthly peak of $92.63.
WTI: Daily chart
Trend: Further weakness expected