USD/CHF Price Analysis: Battles at the 100-DMA around 0.9380s
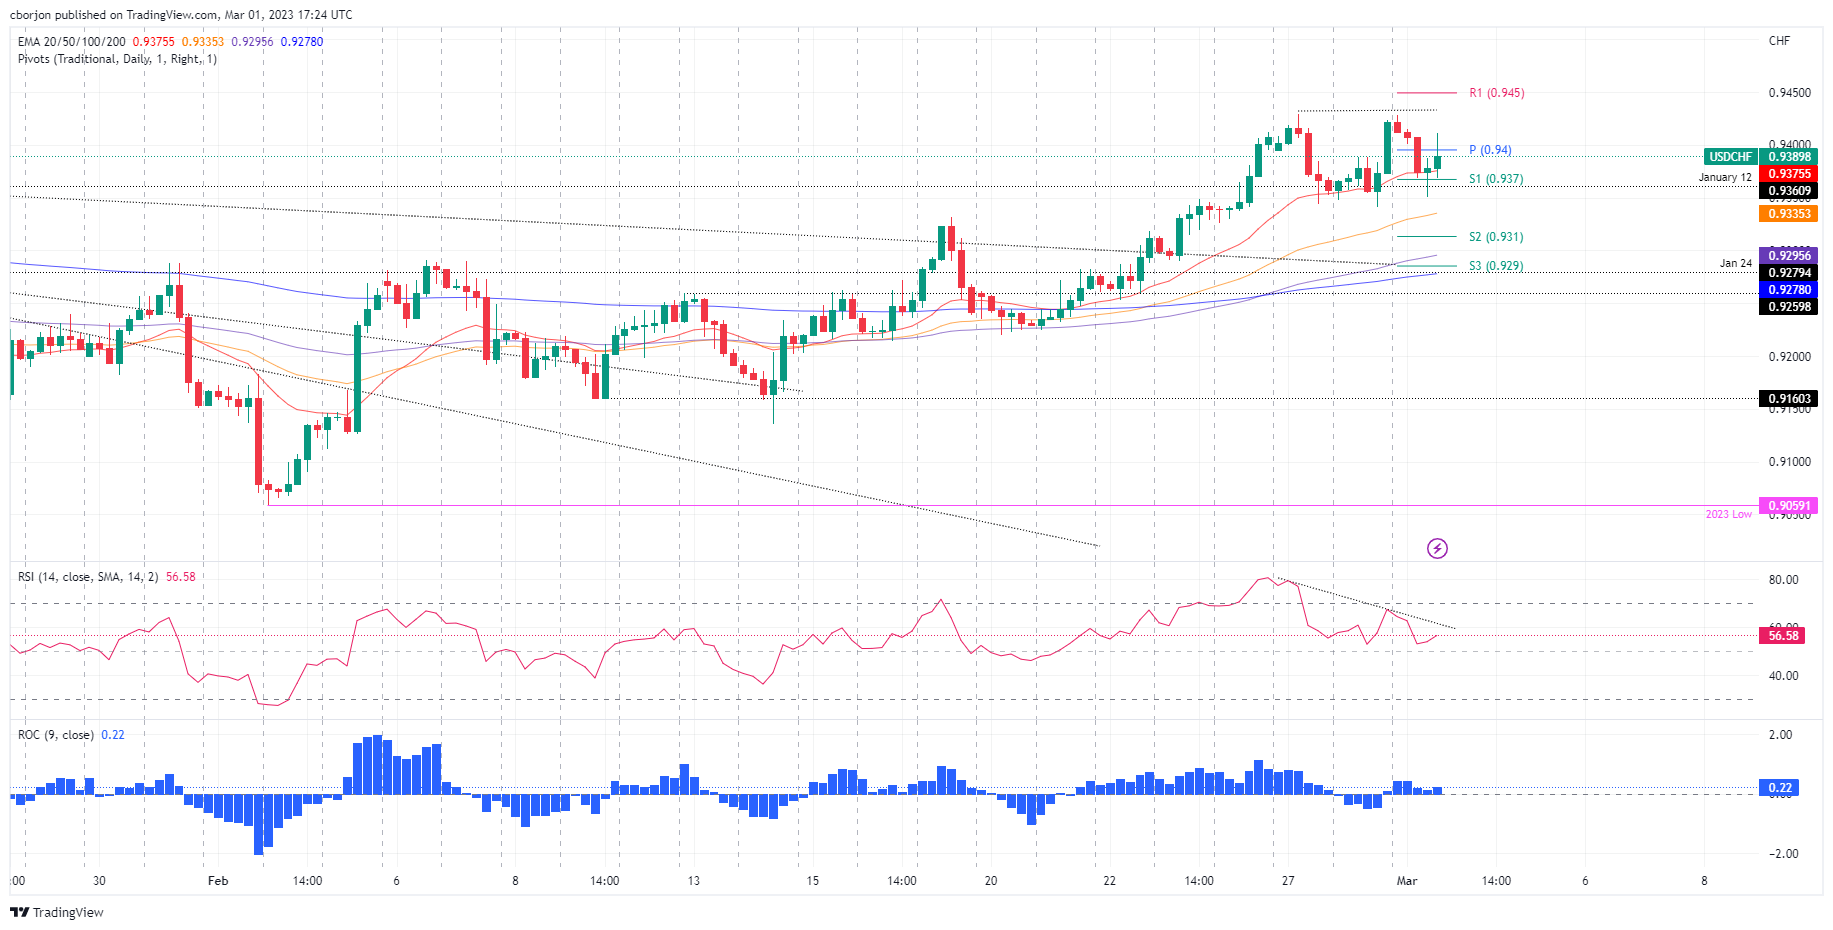
- USD/CHF is trapped within the 0.9340-0.9425 region for the fourth straight day.
- USD/CHF Price Analysis: Negative divergence in the 4-hour chart opened the door for further losses.
The USD/CHF is trimming some of Tuesday’s gains, dropping slightly above the 100-day Exponential Moving Average (EMA), which sits at 0.9384, after hitting a daily high of 0.9428. At the time of writing, the USD/CHF exchanges hands at 0.9387, below its opening price by 0.36%.
USD/CHF Price action
Since the start of the week, the USD/CHF remains range-bound within the 0.9340-0.9425 area. The Relative Strength Index (RSI) portrays buyers in charge, but its slope turned south, suggesting pressure is waning.
The USD/CHF 4-hour chart paints a different picture. As price action edged up, the RSI reached lower peaks. That means a negative divergence has formed, which usually anticipates a reversal. However, the USD/CHF would face solid support levels, as the EMAs are resting below the spot price.
Therefore, the USD/CHF first support would be the 20-EMA at 0.9374. A breach of the latter will expose the weekly low of 0.9341, followed by the 50-EMA at 0.9335, ahead of testing the 0.9300 mark. Once cleared, the next stop for USD/CHF sellers would be the 100-EMA at 0.9295, closely followed by the 200-EMA at 0.9278.
USD/CHF 4-hour chart
USD/CHF Key technical levels