Silver Price Analysis: XAG/USD hints at corrective bounce off $22.80 amid oversold RSI
- Silver price remains sidelined after refreshing two-month low.
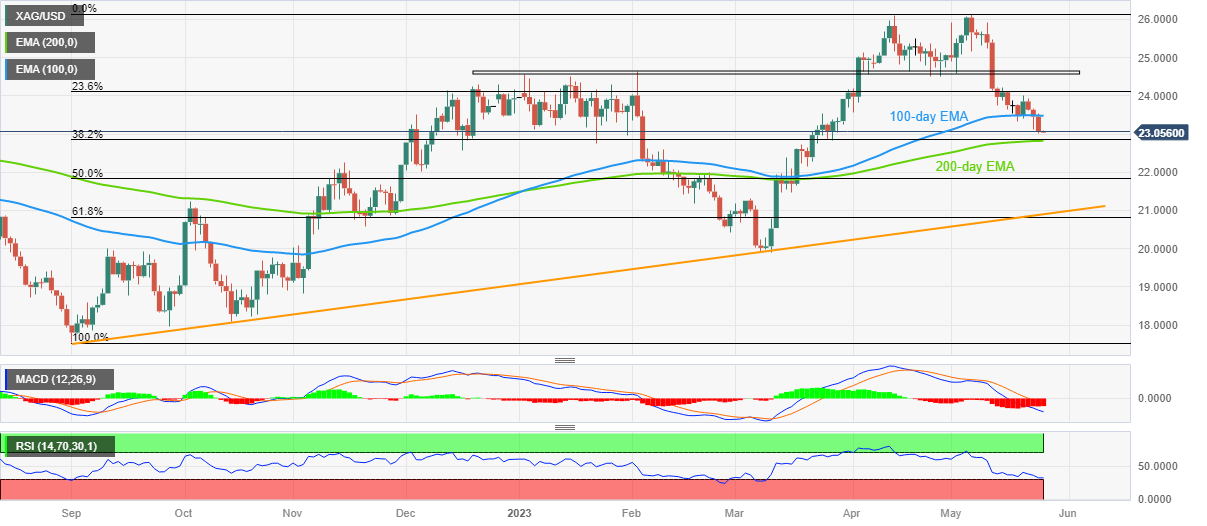
- XAG/USD eyes short-covering as convergence of 200-day EMA, 38.2% Fibonacci retracement joins oversold RSI (14) line.
- 100-day EMA, multi-day-old horizontal resistance can challenge Silver buyers amid bearish MACD signals.
Silver Price (XAG/USD) sellers take a breather at the lowest levels in four weeks, making rounds to $23.00 amid early Thursday in Asia.
In doing so, the bright metal seesaws around the monthly low after falling in the last three consecutive days. That said, the oversold RSI (14) line challenges the XAG/USD’s further downside.
As a result, a convergence of the 200-day Exponential Moving Average (EMA) and 38.2% Fibonacci retracement of the metal’s upside from September 2022 to May 2023, near $22.80, becomes crucial for Silver sellers to watch.
Should the XAG/USD traders ignore the oversold RSI and break the $22.80 support confluence, a quick fall to the 50% Fibonacci retracement level of around $21.80 and then to an upward-sloping support line from September 2022, near $20.90, can’t be ruled out.
On the flip side, a daily closing beyond the 100-day EMA level of $23.50 becomes necessary to expect the Silver Price recovery.
Even so, a horizontal area comprising multiple levels marked since early 2023, near $24.55-65, will be the key to challenging the XAG/USD buyers before giving them control.
Overall, Silver price is likely to witness a corrective bounce from the aforementioned support but the upside room appears limited.
Silver Price: Daily chart
Trend: Short-term rebound expected