WTI Price Analysis: Crude Oil fades around $80 toward weekly low on China’s economic woes
- WTI Crude Oil extends its losses due to China’s deteriorating economic situation.
- 21-day EMA appears to be the key support lined up with the $80.00 psychological level.
- MACD indicates a changing bias of WTI buyers: 14-day RSI still supports the bullish bias.
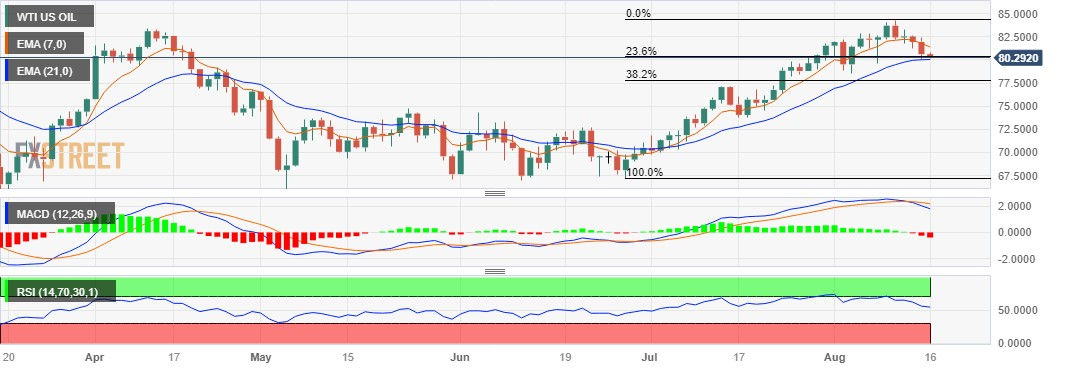
WTI Crude Oil trades lower near $80.30 lined up with the 23.6% Fibonacci retracement level, extending its losses on the third consecutive day during the Asian session on Wednesday. The black gold continues the bearish trend due to the risk-off mood and China’s deteriorating economic conditions.
The 21-day Exponential Moving Average (EMA) at $80.04 appears to be the key support level aligned to the $80.00 psychological level. A firm break below the latter could push the WTI price to explore the territory around the 38.2% Fibonacci retracement level at $77.81.
The Moving Average Convergence Divergence (MACD) line stays in the positive territory of the centerline but shows divergence below the signal line, which could indicate the changing bias of WTI traders. However, the 14-day Relative Strength Index (RSI) continues to remain above 50, still indicating a bullish sentiment of WTI buyers.
On the upside, the pair could find immediate resistance near the 7-day EMA at $81.41, following the area around the $82.00 psychological level.
WTI US Oil: Daily Chart