13 Jun 2018
GBP/USD Technical Analysis: bearish pressure to aggravate below 1.3300 mark
• After a modest rebound to the 1.3340-45 region, the pair is slowly drifting back towards the post-UK CPI swing lows.
• Weakness below the 1.3300 handle will confirm a short-term descending trend-channel breakdown and pave the way for an extension of the depreciating slide.
• With technical indicators holding in negative territory, acceptance below short-term moving averages further reinforces the bearish outlook.
GBP/USD 1-hourly chart
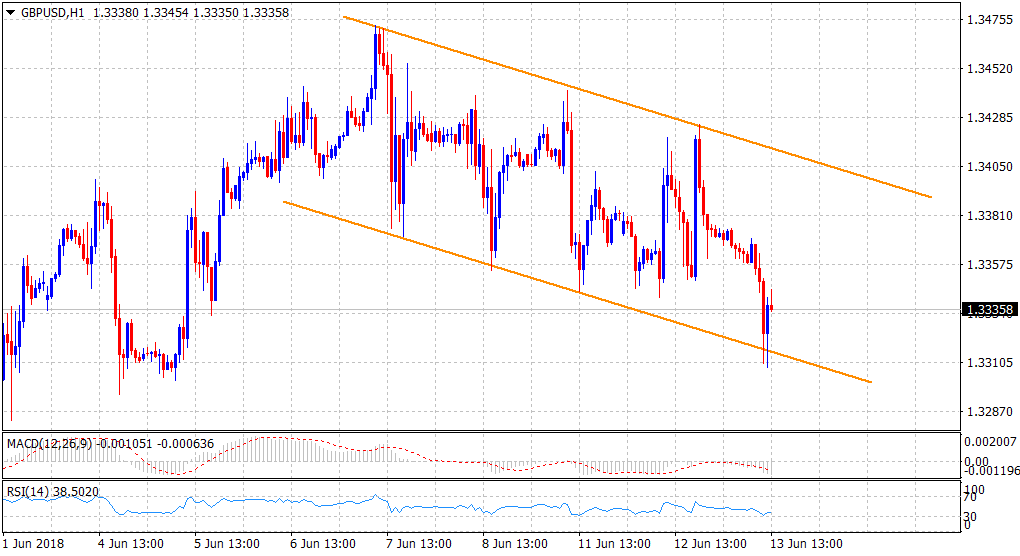
Current Price: 1.3336
Daily High: 1.3375
Daily Low: 1.3308
Trend: Bearish
Resistance
R1: 1.3371 (Tuesday's closing level)
R2: 1.3399 (5-day SMA)
R3: 1.3464 (R2 daily pivot-point)
Support
S1: 1.3308 (daily swing low)
S2: 1.3251 (S3 daily pivot-point)
S3: 1.3295 (4 June swing low)