Gold Technical Analysis: confirms a fresh bearish breakdown
• The bearish momentum extends to break below a medium-term ascending trend-line, extending from Jan. 2017 lows through lows touched in July/Dec. 2017.
• Formation of a death-cross on the daily chart (50-day SMA crossing 200-day SMA from the top) further reinforces the bearish breakdown.
• Near-term oversold conditions might turn out to be the only factor prompting some short-covering and help limit immediate sharp downside.
Gold daily chart
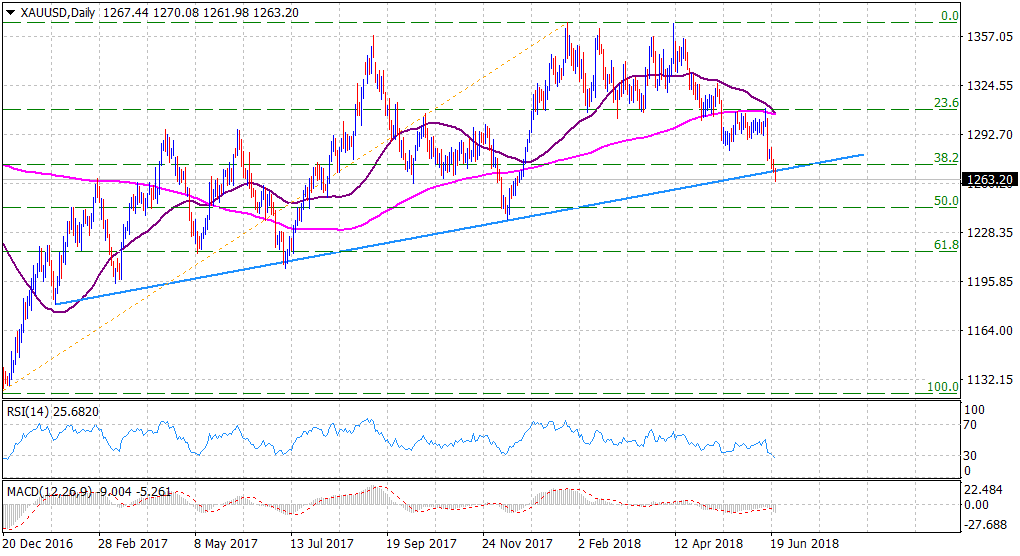
Current Price: $1263
Daily High: $1270
Daily Low: $1262
Trend: Bearish
Resistance
R1: $1268.60 (ascending trend-line support break-point)
R2: $1273 (38.2% Fibo. level of the $1123-$1366 up-move)
R3: $1280 (last week's closing level)
Support
S1: $1260.60 (Oct. 2017 swing low)
S2: $1252 (Horizontal level)
S3: $1244 (50% Fibo. level)