12 Jul 2018
Dollar Index Technical Analysis: Pullback has ended
- The dollar index (DXY) hourly chart shows an upside break of the falling trendline and an inverse head-and-shoulders breakout.
- So, the pullback from the recent high of 95.53 has ended, however, upside may lose momentum as the hourly RSI is flashing overbought conditions.
Hourly chart
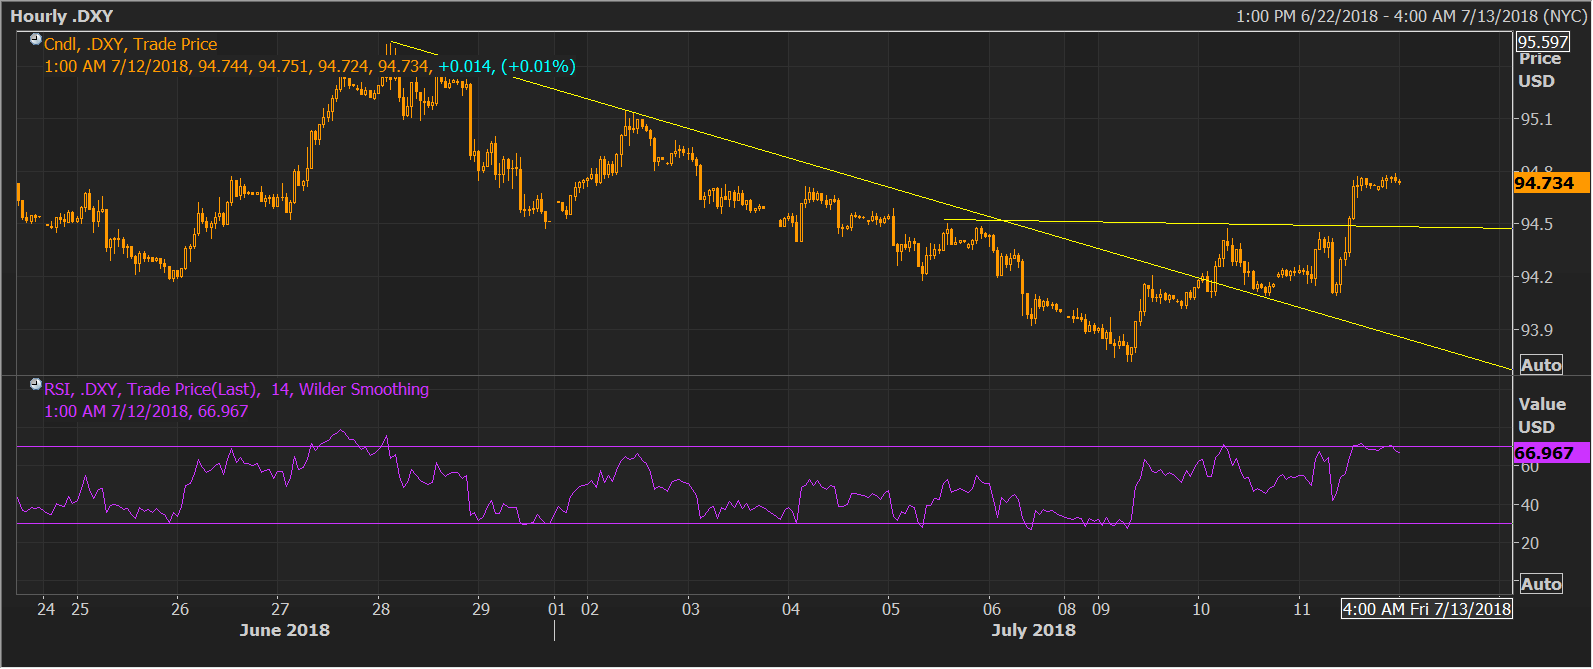
Spot Rate: 94.73
Daily High: 94.79
Daily Low: 94.69
Trend: Cautiously bullish
Resistance
R1: 95.02 (May 29 high)
R2: 95.30 (June 19 high)
R3: 95.53 (June 21 high)
Support
S1: 94.69 (session low)
S2: 94.47 (inverse head-and-shoulders neckline support)
S3: 94.00 (psychological support)