13 Sep 2018
USD/MXN Technical Analysis: Sharp decline to test strong trendline
- The Mexican peso completed four days of gains against the US dollar and accelerated the move today, supported by some positive sentiment toward emerging markets.
- The USD/MXN pair was rejected last week from above 19.40, yesterday broke under 19.15 and today below 19.00 and the 20-day moving average, all key technical levels.
- The short-term outlook favors the downside but some consolidation ahead seems likely considering the sharp slide and the importance of the 18.80 area. A break lower would clear the way to more losses with potential targets at 18.70 and 18.50.
- A modest rebound form 18.80 could be seen before another leg lower if the current bearish pressure eases. Risks are tilted to the downside.
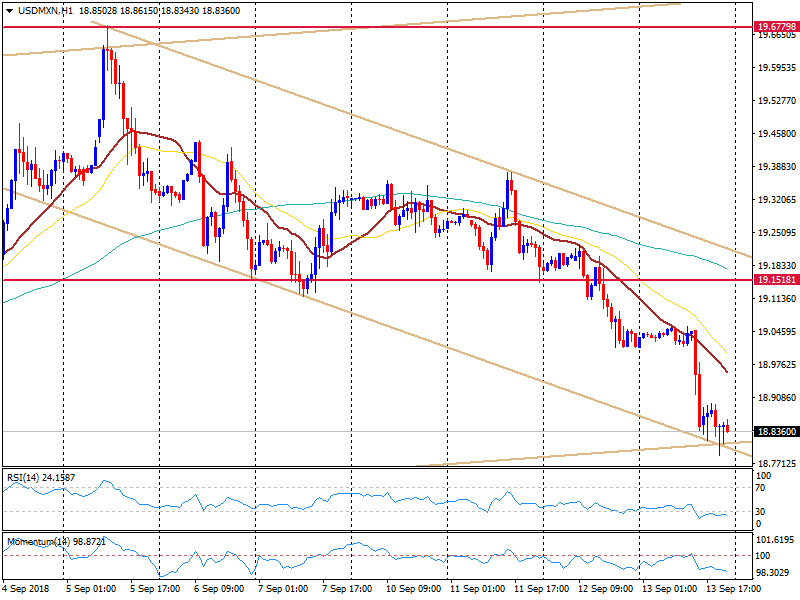
USD/MXN 1-hour chart
USD/MXN Daily Chart
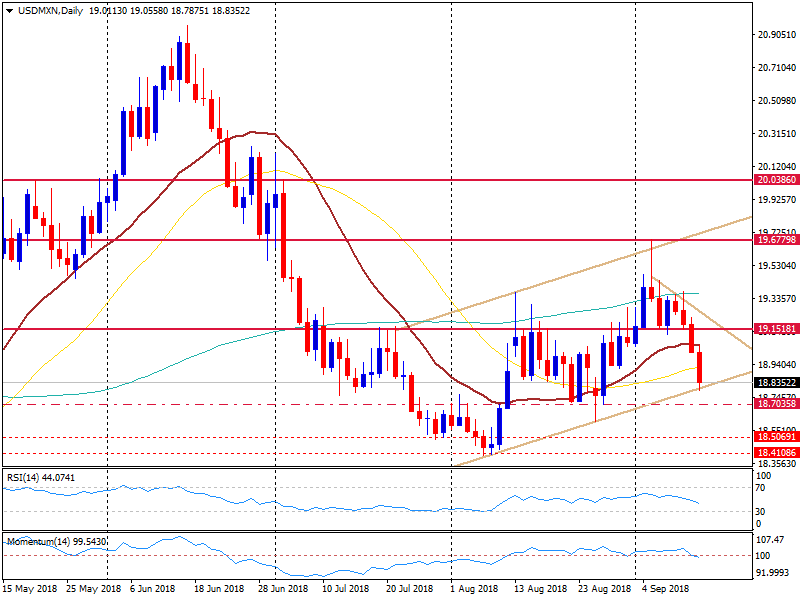
Spot: 18.85
Daily high: 19.05
Daily low: 18.78
Support Levels
S1: 18.80
S2: 18.70
S3: 18.50
Resistance Levels
R1: 18.90
R2: 19.05
R3: 19.20