18 Sep 2018
USD/JPY Technical Analysis: Bulls breaking 112.17 swing high looking to reach the 2018 high
- USD/JPY bulls are resuming the main bull trend as they broke above 112.17 (August 1, swing high).
- USD/JPY is trading above rising and widening 50, 100 and 200-period simple moving averages suggesting bullish momentum.
- The next target for bulls is likely located near 112.50 figure and 113.18, 2018 high
USD/JPY 4-hour chart
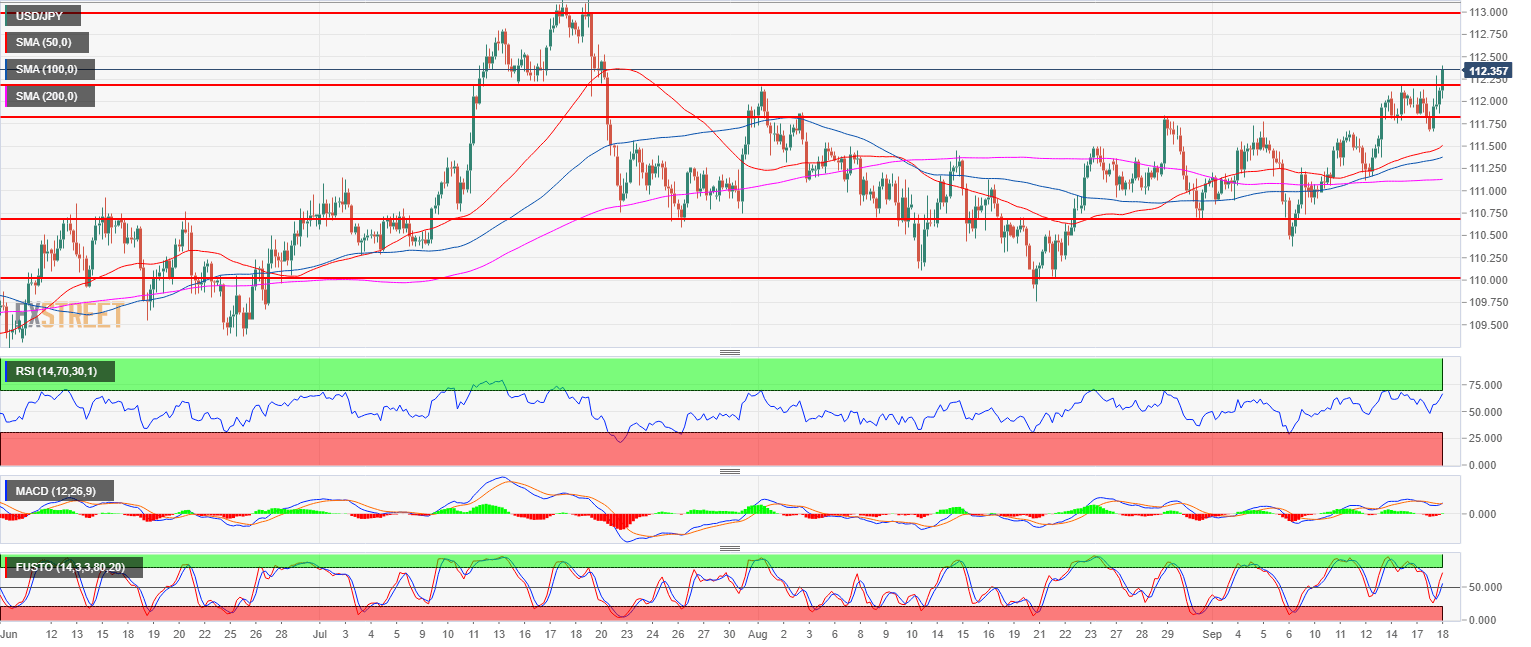
Spot rate: 111.36
Relative change: 0.47%
High: 112.40
Low: 111.66
Main trend: Bullish
Resistance 1: 112.50 figure
Resistance 2: 113.18, 2018 high
Resistance 3: 114.00 figure
Support 1: 112.00-112.17 zone, figure and August 1, swing high
Support 2: 111.84 August 29 swing high
Support 3: 111.84 August 29 swing high
Support 4: 111.54 August 6, high
Support 5: 111.45 August 8 high
Support 6: 111.00 figure
Support 7: 110.75, July 23 swing low
Support 8: 110.00 figure
Support 9: 109.37 June 25 low