USD/CHF Technical Analysis: Greenback is set to revisit 0.9920 - FOMC minutes eyed
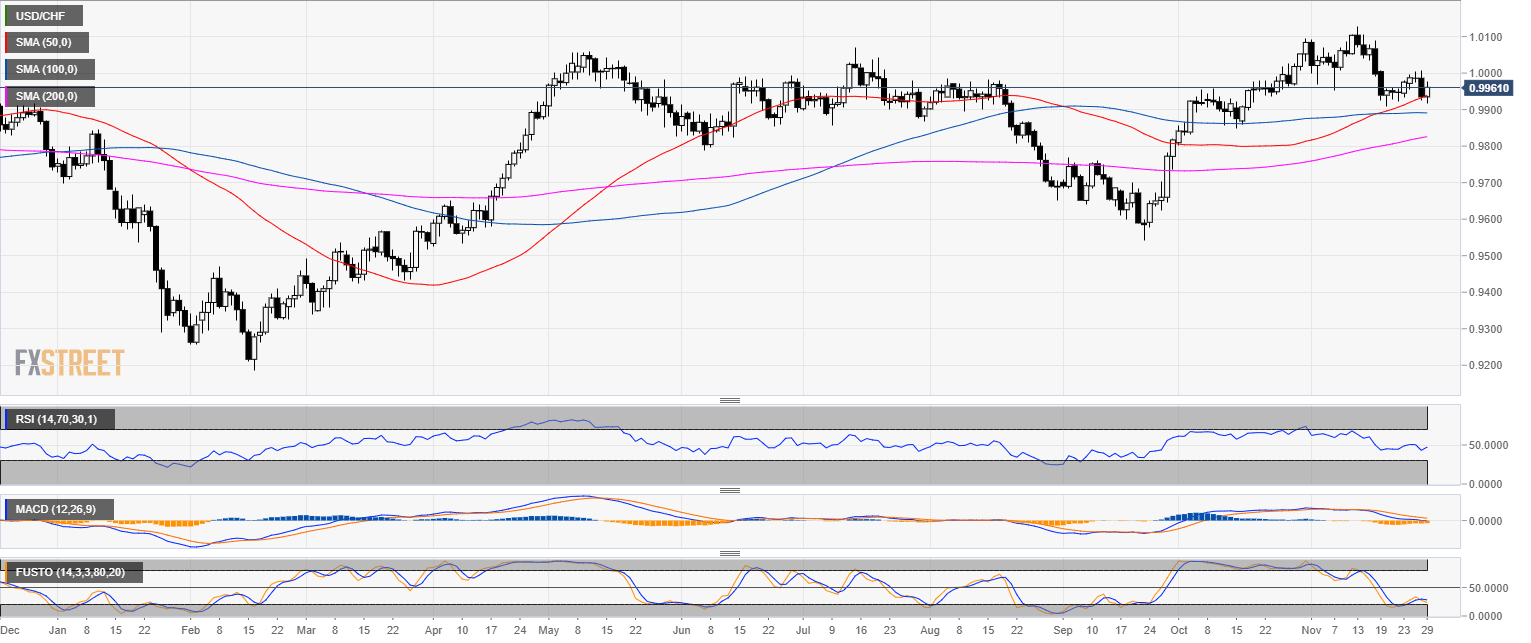
USD/CHF daily chart
- USD/CHF is trading in a bull trend below the 200-day simple moving average (SMA)
- USD/CHF found some support above the 50 SMA as technical indicators are in bearish territories
- The FOMC minutes scheduled at 19.00 GMT can lead to extreme volatility in the forex market.
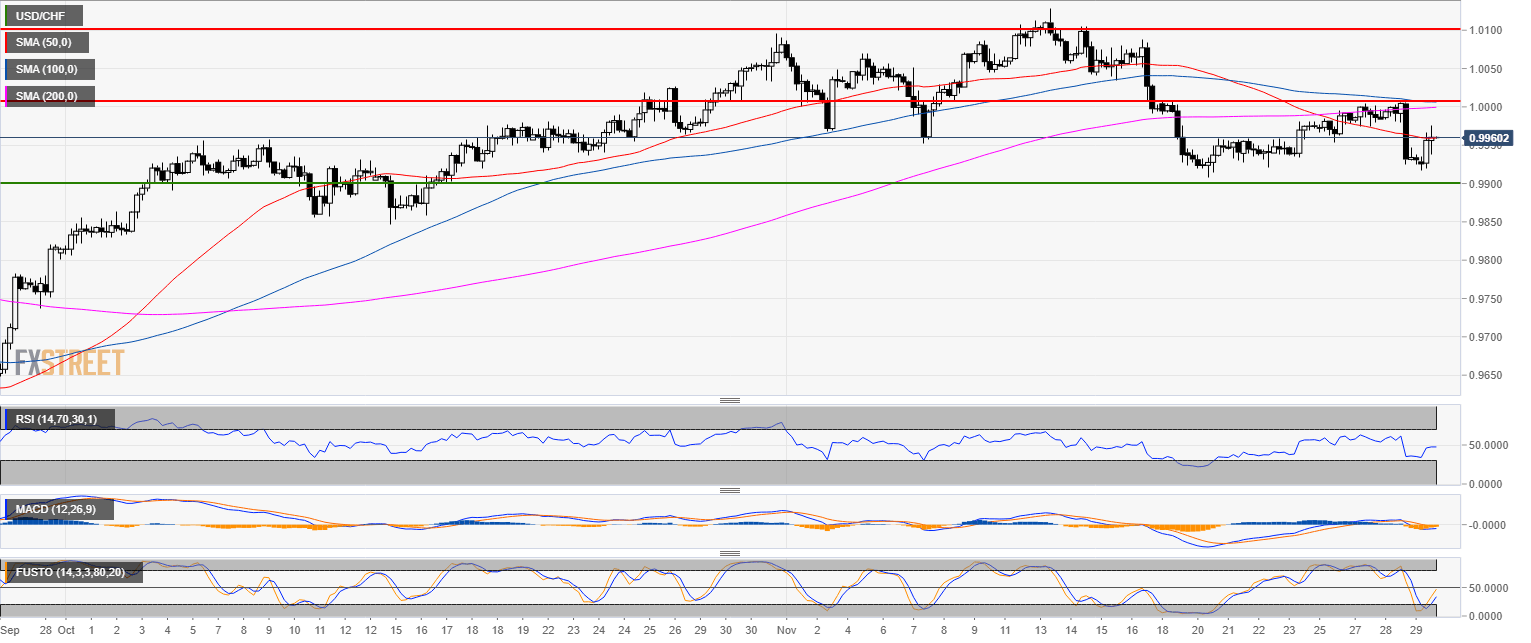
USD/CHF 4-hour chart
- USD/CHF is finding resistance at the 50 SMA while the market strongly broke below the 200 SMA.
- Technical indicators are neutral to bearish.
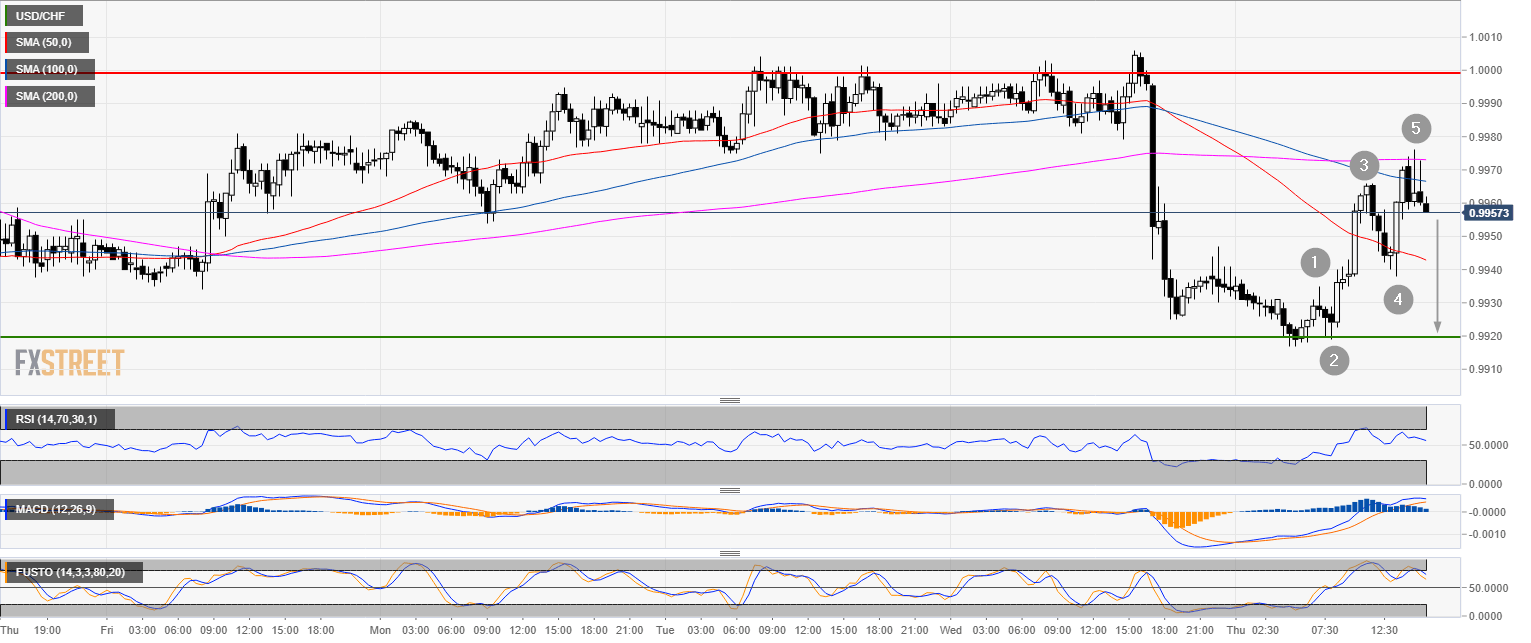
USD/CHF 30-minute chart
- USD/CHF printed a 5-wave pattern which can send the pair down to 0.9920.
- USD/CHF found resistance at the 100 and 200 SMA.
Additional key levels
USD/CHF
Overview:
Today Last Price: 0.996
Today Daily change: 25 pips
Today Daily change %: 0.252%
Today Daily Open: 0.9935
Trends:
Previous Daily SMA20: 1.0011
Previous Daily SMA50: 0.9932
Previous Daily SMA100: 0.9892
Previous Daily SMA200: 0.982
Levels:
Previous Daily High: 1.0006
Previous Daily Low: 0.9925
Previous Weekly High: 1.0012
Previous Weekly Low: 0.9908
Previous Monthly High: 1.0096
Previous Monthly Low: 0.9801
Previous Daily Fibonacci 38.2%: 0.9956
Previous Daily Fibonacci 61.8%: 0.9975
Previous Daily Pivot Point S1: 0.9905
Previous Daily Pivot Point S2: 0.9874
Previous Daily Pivot Point S3: 0.9823
Previous Daily Pivot Point R1: 0.9986
Previous Daily Pivot Point R2: 1.0036
Previous Daily Pivot Point R3: 1.0067