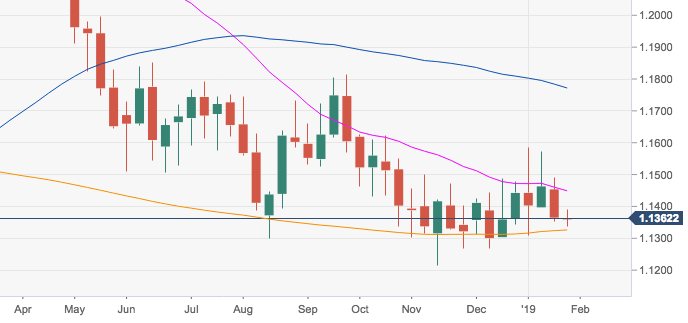
EUR/USD Technical Analysis: The 200-week SMA near 1.1320 seen holding the downside so far
- EUR/USD remains under pressure so far this week. However, the leg lower appears so far contained in the boundaries of the 200-week SMA.
- A breakdown of this key support level should open the door for a potential re-visit of YTD lows in the 1.1300 neighbourhood, while extra pullbacks should meet the next stop at December low in the 1.1270 region.
- Furthermore, the bearish view on spot is expected to prevail while below the short-term resistance line, today at 1.1540.
EUR/USD weekly chart
EUR/RUB
Overview:
Today Last Price: 75.3825
Today Daily change: -0.1450 pips
Today Daily change %: -0.19%
Today Daily Open: 75.5275
Trends:
Daily SMA20: 77.2425
Daily SMA50: 76.4587
Daily SMA100: 76.6319
Daily SMA200: 75.573
Levels:
Previous Daily High: 75.6545
Previous Daily Low: 75.3335
Previous Weekly High: 77.223
Previous Weekly Low: 75.1415
Previous Monthly High: 79.9638
Previous Monthly Low: 74.8274
Daily Fibonacci 38.2%: 75.5319
Daily Fibonacci 61.8%: 75.4561
Daily Pivot Point S1: 75.3558
Daily Pivot Point S2: 75.1842
Daily Pivot Point S3: 75.0348
Daily Pivot Point R1: 75.6768
Daily Pivot Point R2: 75.8262
Daily Pivot Point R3: 75.9978