EUR/GBP Technical Analysis: Euro is dropping to new 2019 lows against Sterling
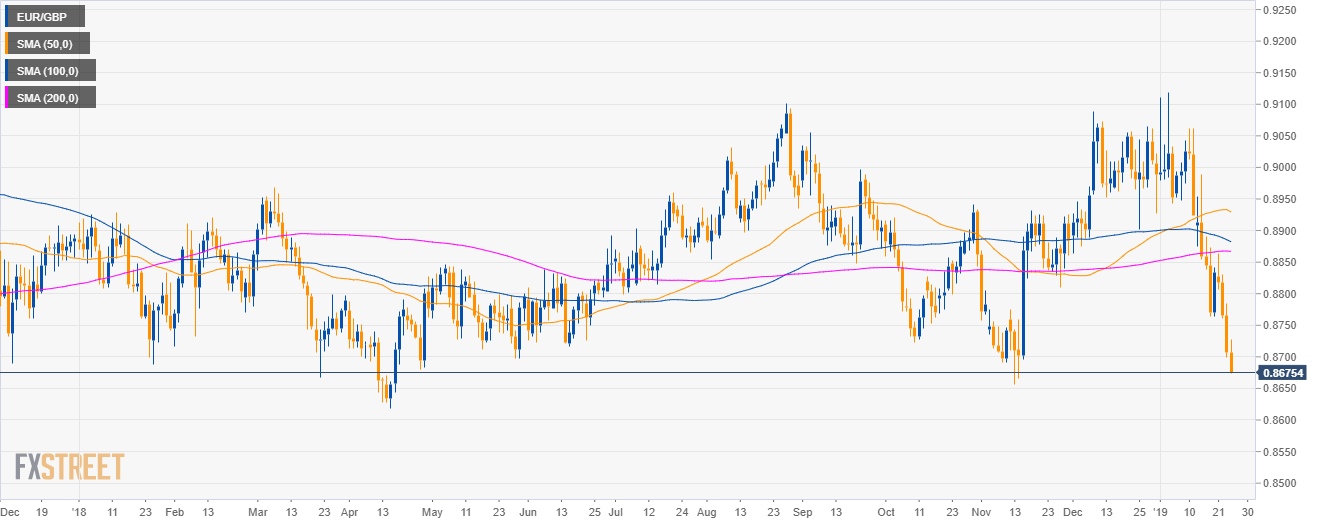
EUR/GBP daily chart
- EUR/GBP is trading in a sideways trend below the 50, 100 and 200-day simple moving averages (SMAs).
EUR/GBP 4-hour chart
- EUR/GBP is dropping below the main SMAs as the market is printing new 2019 lows.

EUR/GBP 30-minute chart
- The bears are in control of the market as EUR/GBP is trading below its main SMAs.
- The next level of support is seen at 0.8650 and 0.8600 figure.

Additional key levels
EUR/GBP
Overview:
Today Last Price: 0.8675
Today Daily change: - 33 pips
Today Daily change %: -0.38%
Today Daily Open: 0.8708
Trends:
Daily SMA20: 0.8923
Daily SMA50: 0.8933
Daily SMA100: 0.8885
Daily SMA200: 0.8867
Levels:
Previous Daily High: 0.8784
Previous Daily Low: 0.8698
Previous Weekly High: 0.8988
Previous Weekly Low: 0.8764
Previous Monthly High: 0.9089
Previous Monthly Low: 0.8863
Daily Fibonacci 38.2%: 0.8731
Daily Fibonacci 61.8%: 0.8751
Daily Pivot Point S1: 0.8676
Daily Pivot Point S2: 0.8644
Daily Pivot Point S3: 0.8591
Daily Pivot Point R1: 0.8761
Daily Pivot Point R2: 0.8815
Daily Pivot Point R3: 0.8847