14 Feb 2019
EUR/USD Technical Analysis: A drop to 2018 lows at 1.1215 still remains in the pipeline
- After bottoming out in the 1.1250/48 band in early trade, EUR/USD attracted some buying interest and it has regained some shine since then.
- However, the likeliness of a deeper pullback to the area of 2018 lows at 1.1250 stays well and sound as long as the resistance line at 1.1494 caps the upside.
- Downside pressure, however, is expected to alleviate on a surpass of the 100-day SMA, today at 1.1410.
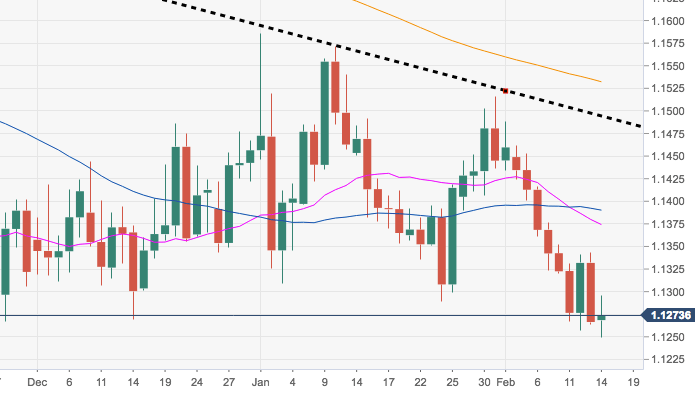
EUR/USD daily chart
EUR/USD
Overview:
Today Last Price: 1.1267
Today Daily change: 46 pips
Today Daily change %: 0.01%
Today Daily Open: 1.1266
Trends:
Daily SMA20: 1.1379
Daily SMA50: 1.1397
Daily SMA100: 1.1412
Daily SMA200: 1.1535
Levels:
Previous Daily High: 1.1344
Previous Daily Low: 1.1264
Previous Weekly High: 1.1462
Previous Weekly Low: 1.132
Previous Monthly High: 1.1586
Previous Monthly Low: 1.1289
Daily Fibonacci 38.2%: 1.1294
Daily Fibonacci 61.8%: 1.1313
Daily Pivot Point S1: 1.1239
Daily Pivot Point S2: 1.1212
Daily Pivot Point S3: 1.116
Daily Pivot Point R1: 1.1319
Daily Pivot Point R2: 1.1371
Daily Pivot Point R3: 1.1398