12 Mar 2019
USD/INR Technical Analysis: Slips to lowest since Jan. 7
USD/INR is currently trading at 69.6275, the lowest level since Jan. 7. The currency pair is looking south, having found acceptance below the key support of 70.40 (Feb. 13 low) last week.
Daily chart
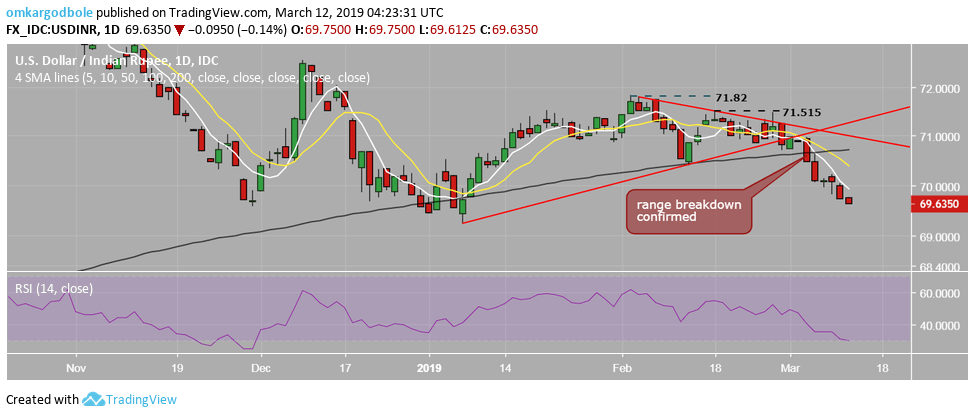
As seen in the above chart, the pair is losing altitude, as suggested by the range breakdown, confirmed on March 5. The 5- and 10-day moving averages (MAs) are trending south, indicating a bearish setup.
A pause, however, may be seen, before a drop toward support at 69.23 (Jan. 7 low), as the 14-day RSI is closing on the oversold territory. Further, the RSI on the hourly and 4-hour chart is reporting oversold conditions with a below-30 print.
Trend: Pause likely before a further drop