S&P500 Technical Analysis: US Stocks en route towards 2,830.00 level
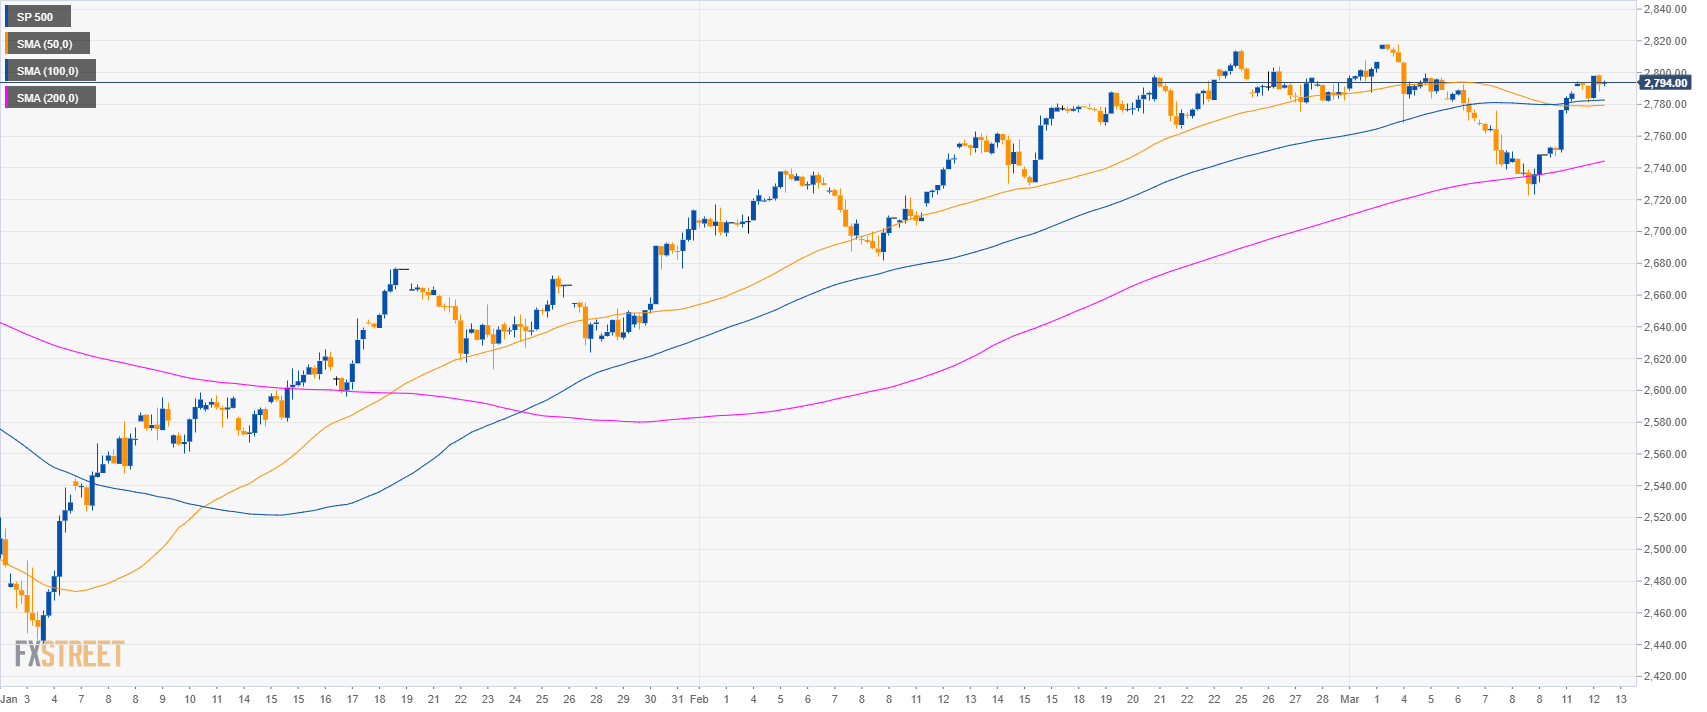
S&P500 daily chart
- The S&P500 is trading above its main simple moving average suggesting bullish momentum.

S&P500 4-hour chart
- The S&P500 is trading above its main SMAs suggesting bullish momentum in the medium-term.
S&P500 60-minute chart
- The S&P500 is trading above its main SMAs suggesting bullish momentum in the short-term.
- A break above 2,800.00 resistance can lead to 2,830.00 level.
- To the downside, supports are seen near 2,770.00 and 2,730.00 level.

Additional key levels
SP 500
Overview:
Today Last Price: 2794.5
Today Daily change: 7.75 points
Today Daily change %: 0.28%
Today Daily Open: 2786.75
Trends:
Daily SMA20: 2777.21
Daily SMA50: 2708.92
Daily SMA100: 2675.72
Daily SMA200: 2752.47
Levels:
Previous Daily High: 2788
Previous Daily Low: 2746.5
Previous Weekly High: 2818
Previous Weekly Low: 2722.5
Previous Monthly High: 2814.25
Previous Monthly Low: 2681.75
Daily Fibonacci 38.2%: 2772.15
Daily Fibonacci 61.8%: 2762.35
Daily Pivot Point S1: 2759.5
Daily Pivot Point S2: 2732.25
Daily Pivot Point S3: 2718
Daily Pivot Point R1: 2801
Daily Pivot Point R2: 2815.25
Daily Pivot Point R3: 2842.5