US Dollar Index technical analysis: Run over 97.90 can validate recent trend-line break
- Break of near-term resistance-line favors upside if crossing a horizontal barrier.
- Slip beneath support-confluence can negate the latest recovery.
Despite breaking a week-long downward sloping trend-line, the US Dollar Index (DXY) struggles to extend recent recovery as it fluctuates around 97.80 ahead of the European open on Friday.
A successful break of 97.90 comprising low of April 26 and latest highs could escalate the pair’s rise to 98.10 and then to the April month high near 98.35/40.
Should there be increased upside momentum past-98.40, 61.8% Fibonacci expansion (FE) of March to May moves, at 98.75 and 99.00 can flash on the bulls’ radar.
Alternatively, a downside break of 97.70 support-confluence including 23.6% Fibonacci retracement of March – April advances and a week-old trend-line, can recall 97.50 on the chart.
However, six-week-old ascending support-line at 97.20,and 50% Fibonacci retracement near 97.00 could question sellers under 97.50, if failed 61.8% Fibonacci retracement near 96.75 and 96.50 can mark their presence.
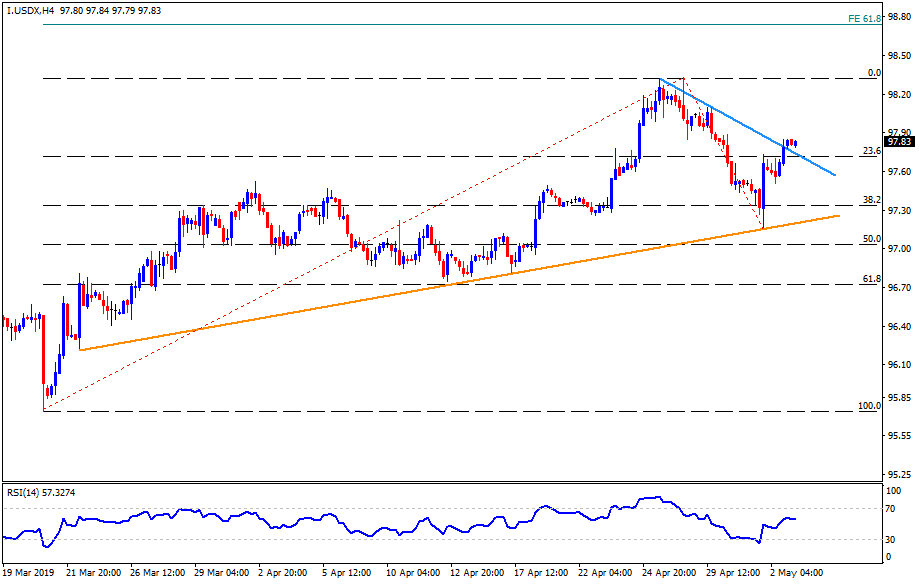
US Dollar Index 4-Hour chart
Trend: Pullback expected