20 May 2019
US Dollar Index technical analysis: Another leg up to the 2019 high can be on the cards
- Federal Reserve Chairman’s Jerome Powell will speak at the Atlanta Fed Financial Markets Conference at 23:00 GMT.
- DXY remains poised for another attempt at the 2019 high.
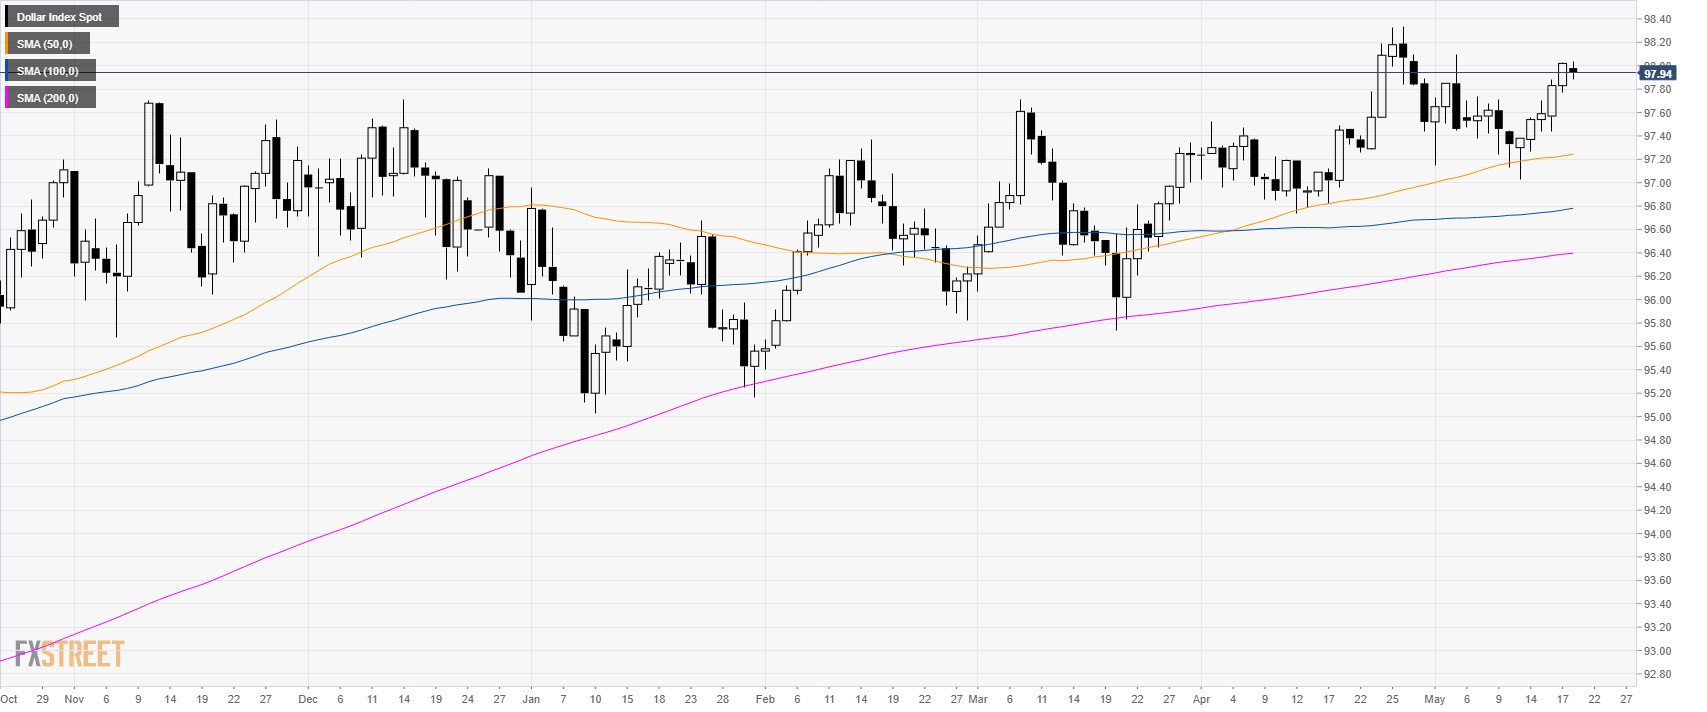
DXY daily chart
The US Dollar Index (DXY) is trading in a bull trend above its main simple moving averages (SMAs).
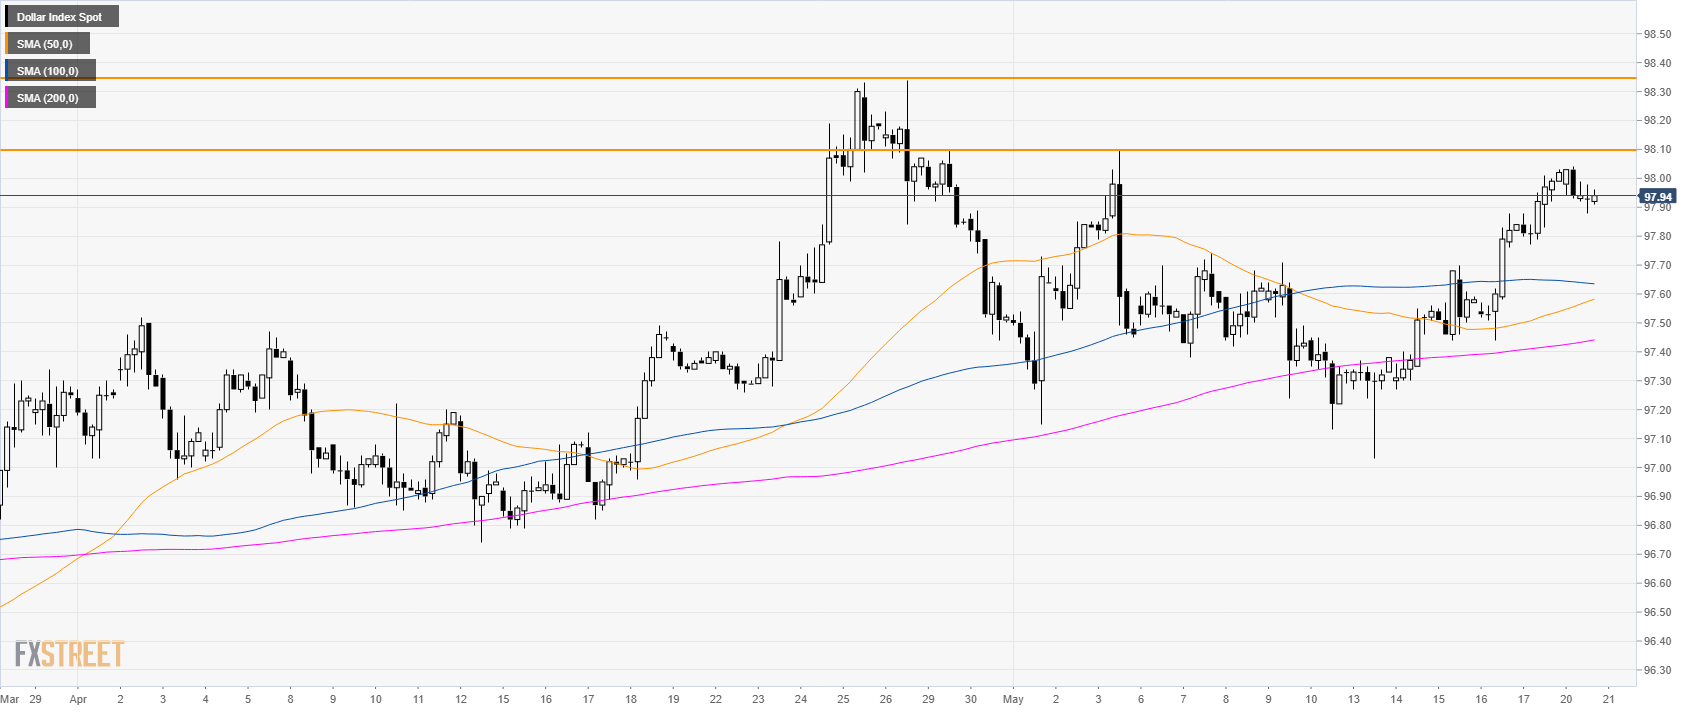
DXY 4-hour chart
The market is trading above its main SMAs suggesting a bullish bias in the near term. The 98.10 and the 98.34 levels are the main targets to the upside.
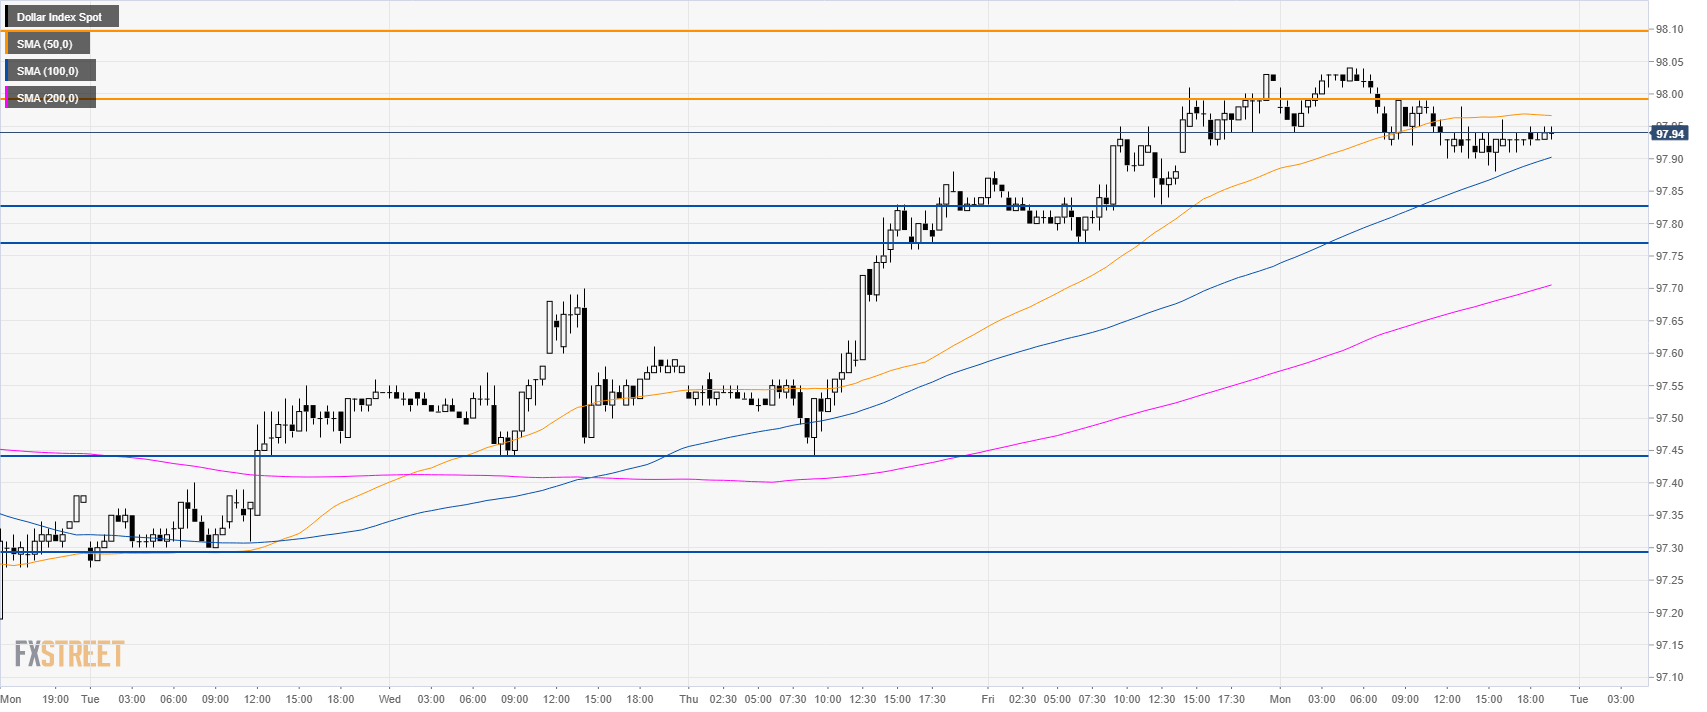
DXY 30-minute chart
The greenback is consolidating the recent gains just below the 98.00 mark. A breakout above the 98.00 figure can open the gates to 98.10 and finally 98.34, the current 2019 high. Immediate support is at 98.83 and 98.77 followed by 97.44, May 16 low.
Additional key levels