29 May 2019
USD/JPY technical analysis: Trading at daily highs and nearing 109.60 resistance
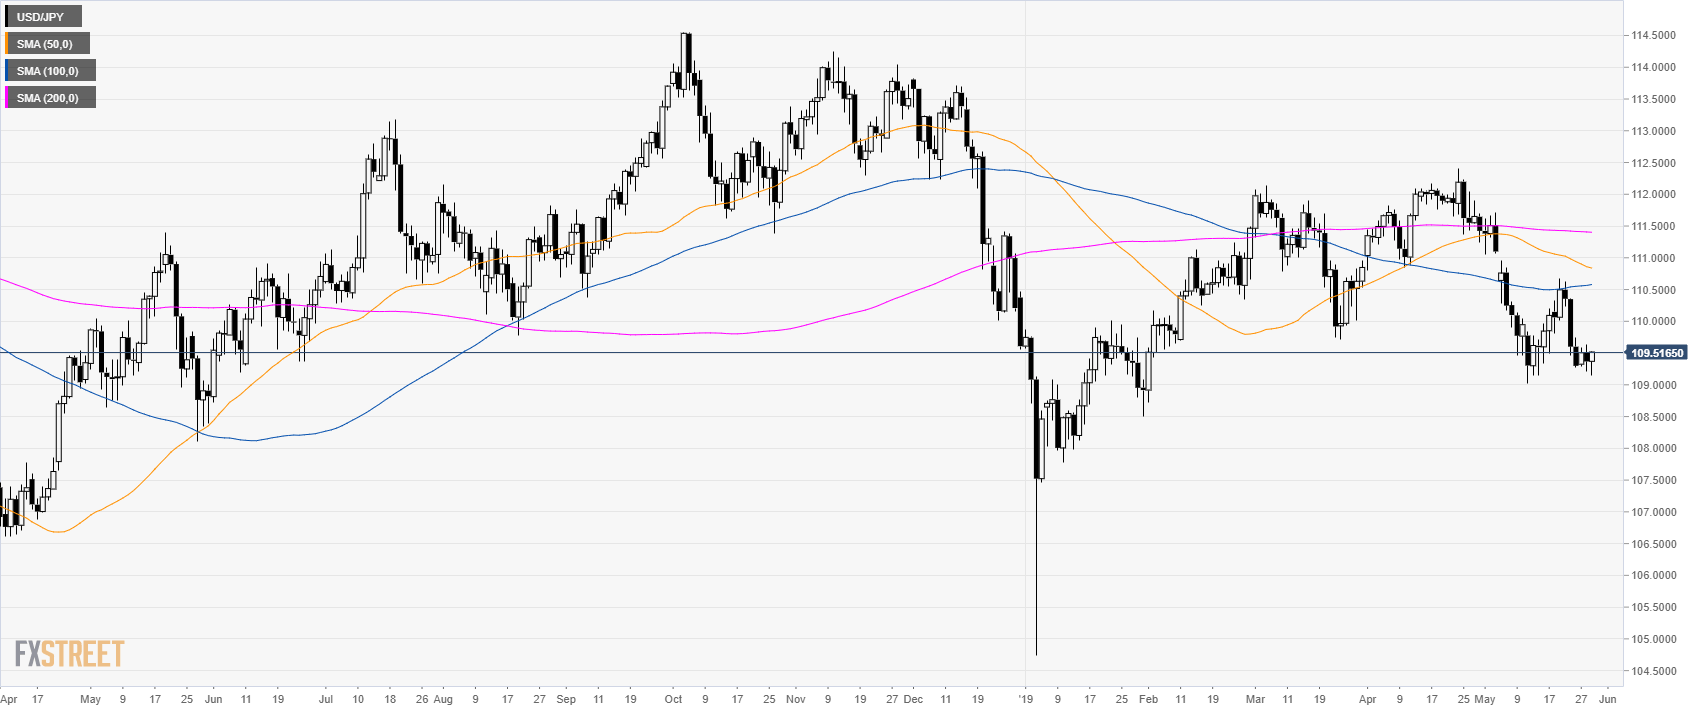
USD/JPY daily chart
USD/JPY is trading at multi-month lows below its main simple moving averages (SMAs).
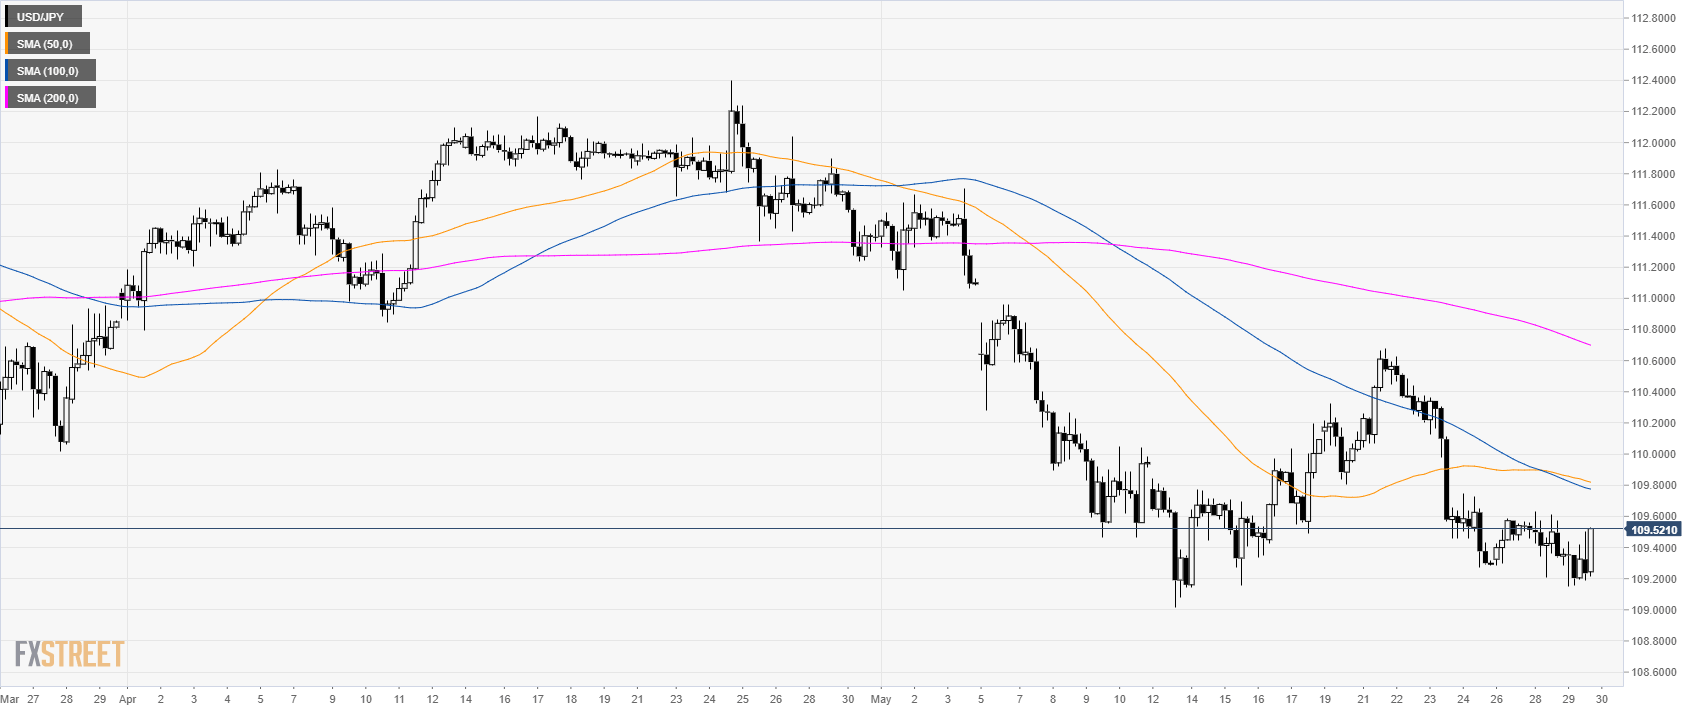
USD/JPY 4-hour chart
USD/JPY is ranging below the main SMAs suggesting a bearish bias in the medium term.
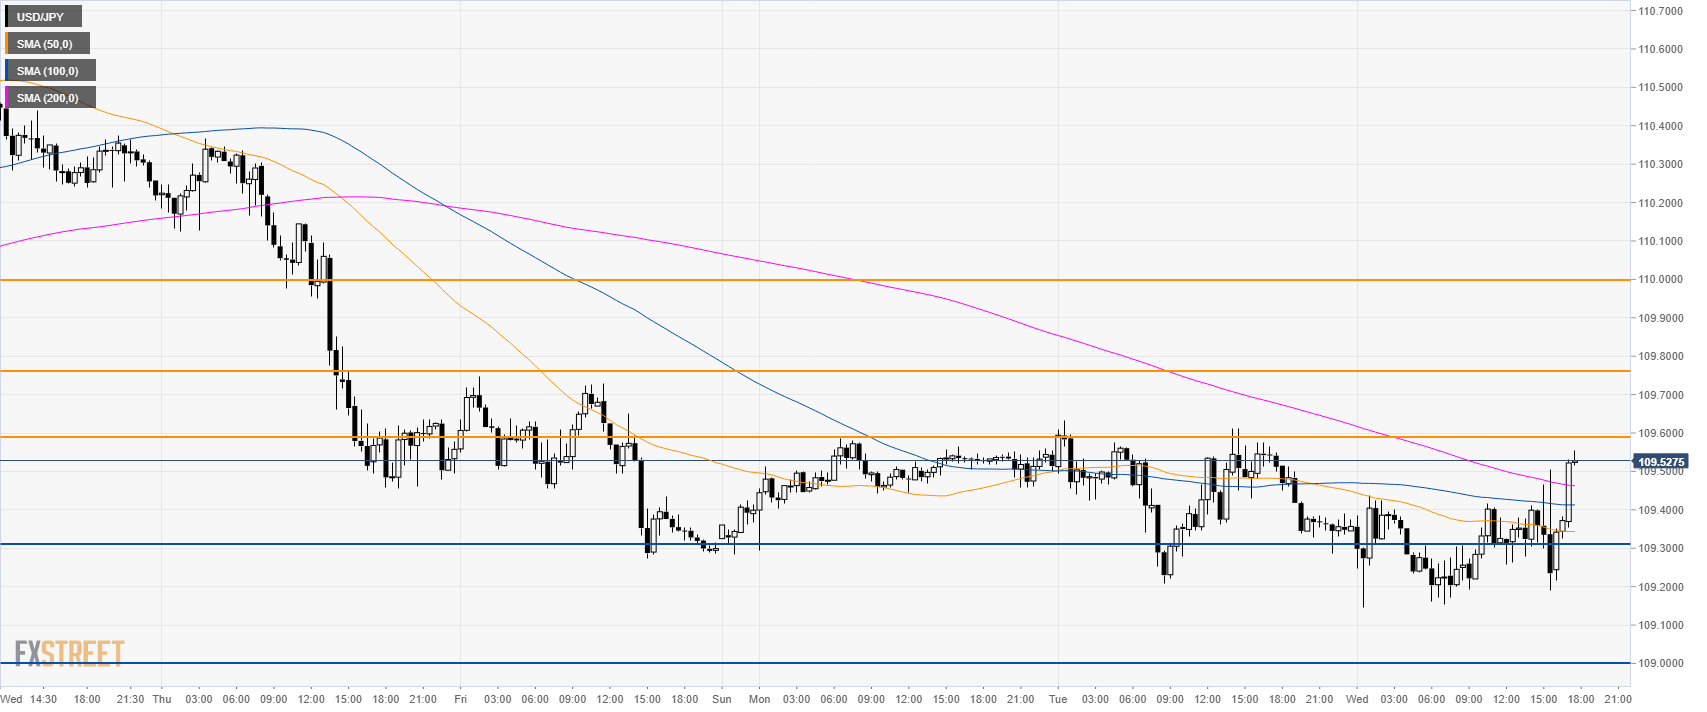
USD/JPY 30-minute chart
USD/JPY is in a range between the 109.30 support and the 109.60 resistance. Buyers will need to overcome 109.75 resistance. If they succeed the 110.00 handle can become next. On the flip side, if the market gets a daily close below 109.30 and 109.00 figure investors can expect further weakness towards 108.00.
Additional key levels