13 Jun 2019
S&P500 technical analysis: US stocks consolidate gains below 2,900.00
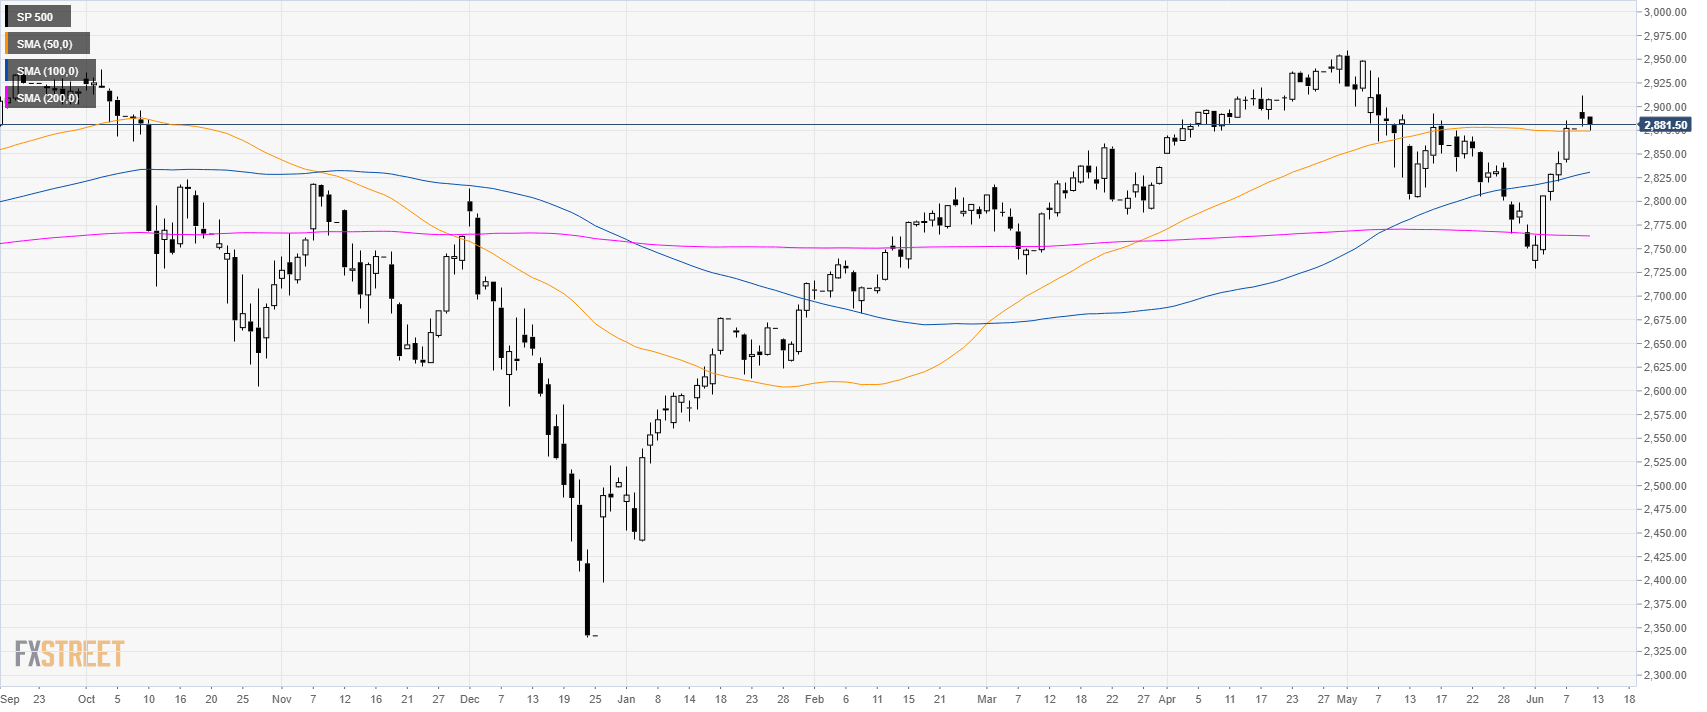
S&P500 daily chart
The S&P500 Index consolidated the recent gains below 2,900.00. The market trades above its main daily simple moving averages (DSMAs).
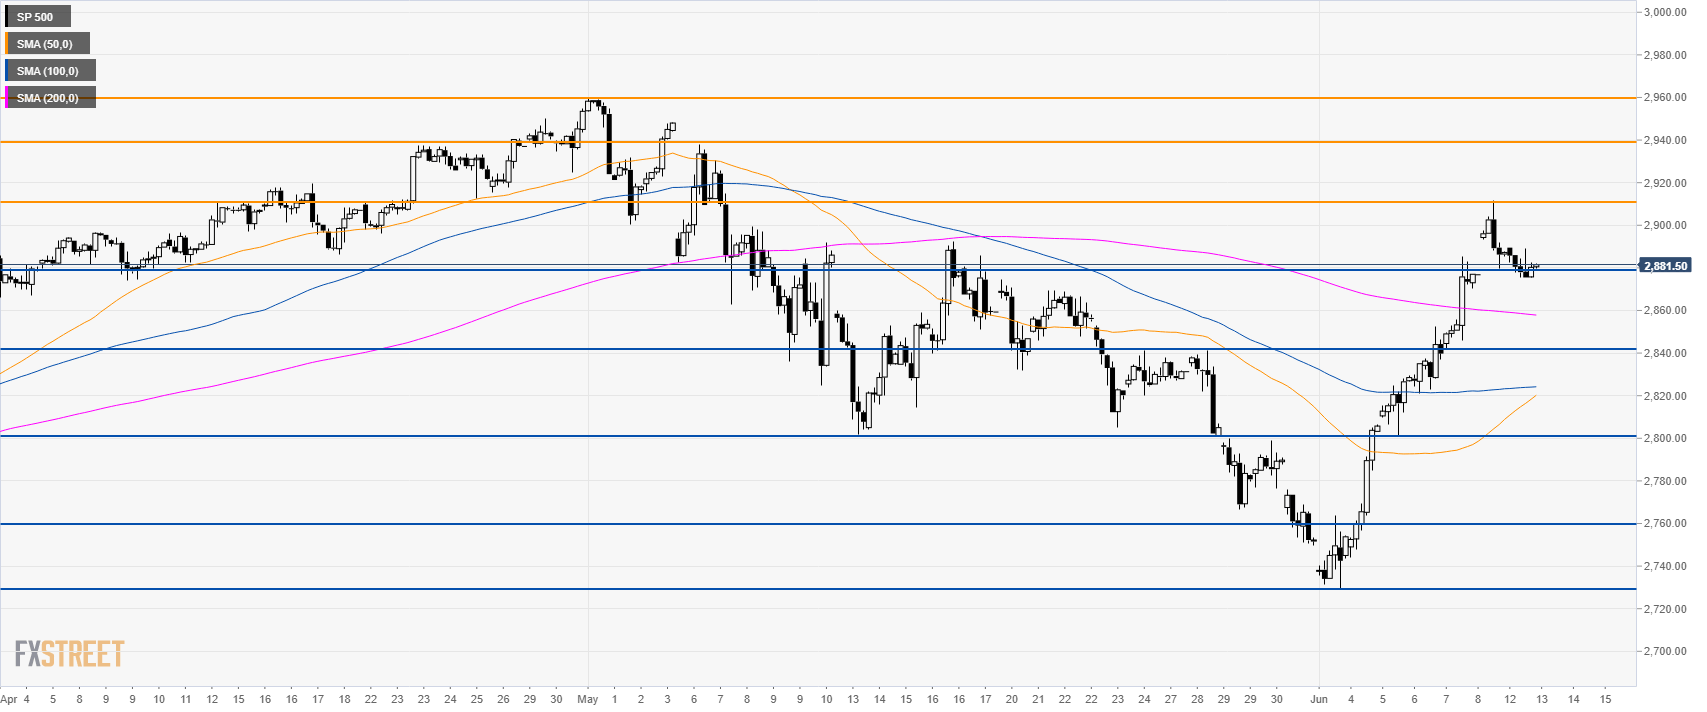
S&P500 4-hour chart
The index is trading above its main SMAs suggesting bullish momentum in the medium term. The level to beat for bulls is at 2,910.00. A break beyond the resistance can lead to 2,940.00 and 2,960.00. Immediate support is at 2,880.00 and 2,840.00.
Additional key levels