WTI technical analysis: Bears to confront multiple rest-points, oversold RSI
- The energy benchmark struggles around monthly lows.
- Multiple supports and oversold RSI can trigger a pullback
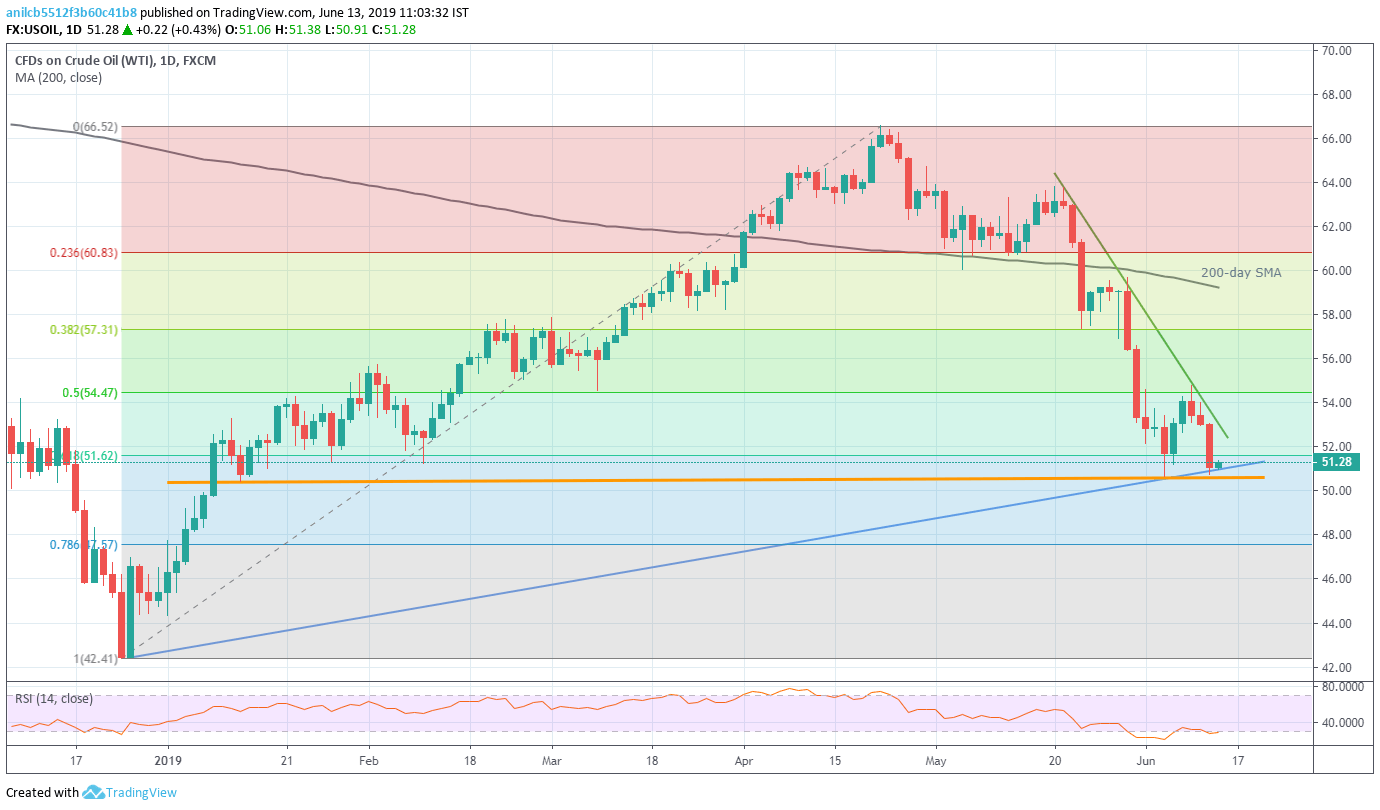
Despite declining beneath 61.8% Fibonacci retracement level, WTI is taking the support of an ascending trend-line stretched since December 2018 as it trades near $51.20 while heading into Europe open on Thursday.
Not only 61.8% Fibonacci retracement of December – April upside, at $51.62, a three-week-old descending resistance-line at $53.20 and current month high near $54.80 also act as near-term key resistances.
In a case where prices rise beyond $54.80, $57.30 and 200-day simple moving average (SMA) near $59.25 could flash on bulls’ radar.
Meanwhile, pair’s slip beneath $51.00 support-line needs to get validation from horizontal-line since mid-May at $50.50 and the $50.00 psychological magnet in order to decline further towards November 2018 bottom at $49.40 and a late-December top close to $47.00.
Other than the aforementioned supports, 14-day relative strength index (RSI) also moves in the oversold region and can challenge the bears.
WTI daily chart
Trend: Pullback expected