18 Jun 2019
US Dollar Index Technical Analysis: Stays supported by the 200-day SMA and support line around 96.50
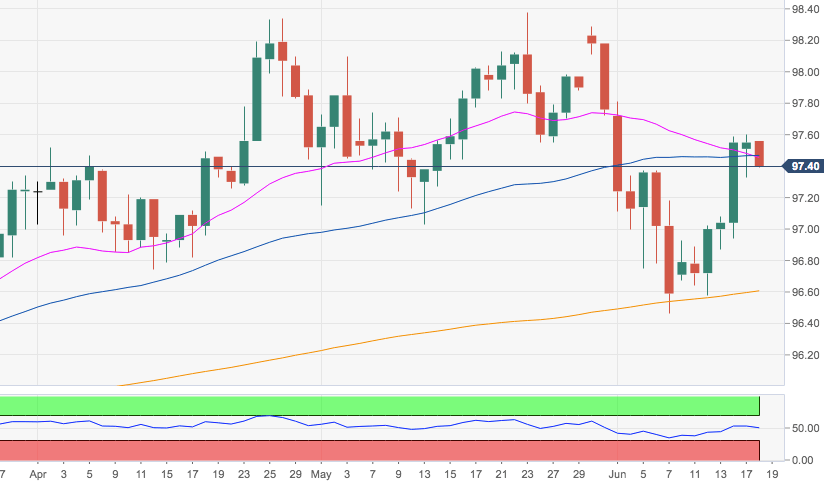
- The recent up move in DXY appears to have met a tough hurdle in the 97.60 region so far this week.
- The index continues to hover around the 55-day and 21-day SMAs in the mid-97.00s. The greenback needs to clear this area on a sustainable basis to allow a test of March high at 97.71, considered the last defence for a move to the 98.00 mark and beyond.
- In the meantime, the 200-day SMA and the multi-month support line in the mid-96.00s should hold the downside and keep the constructive bias intact.
DXY daily chart