
Gold technical analysis: Flatlined in Asia despite flag breakout
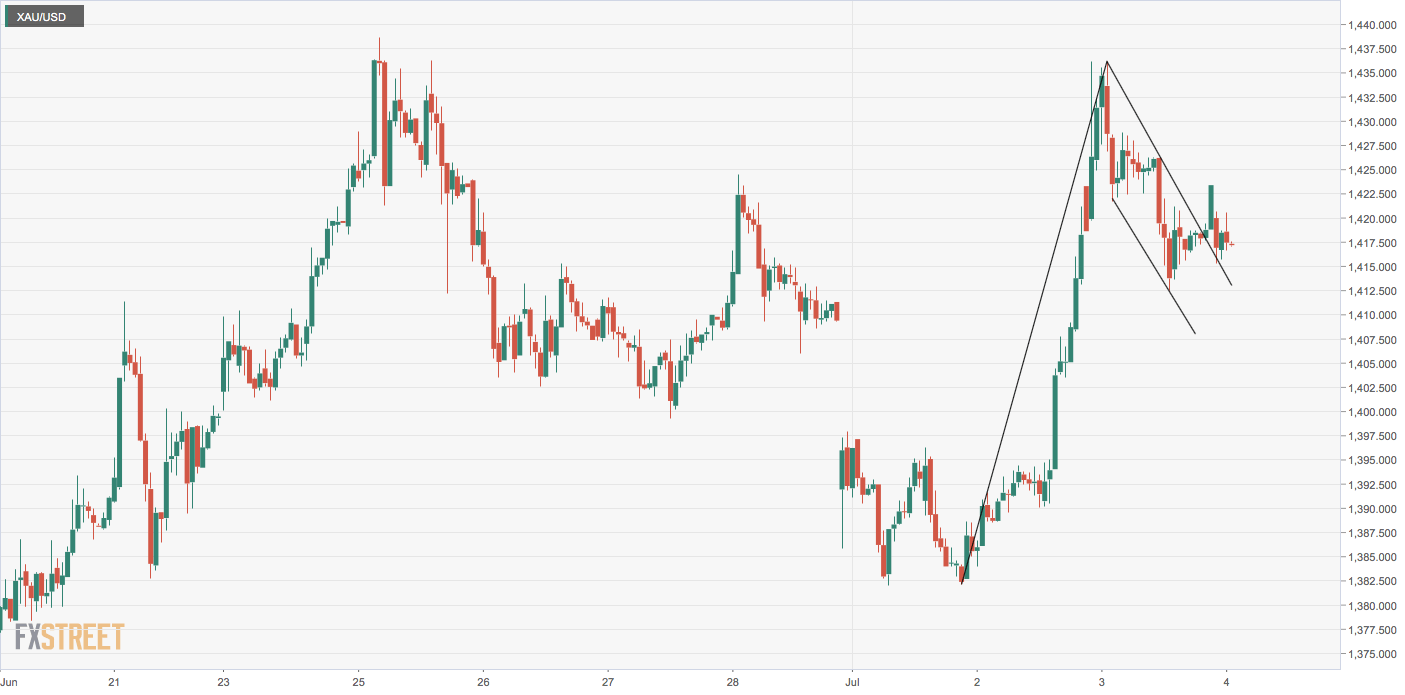
- Gold’s hourly chart shows a bull flag breakout.
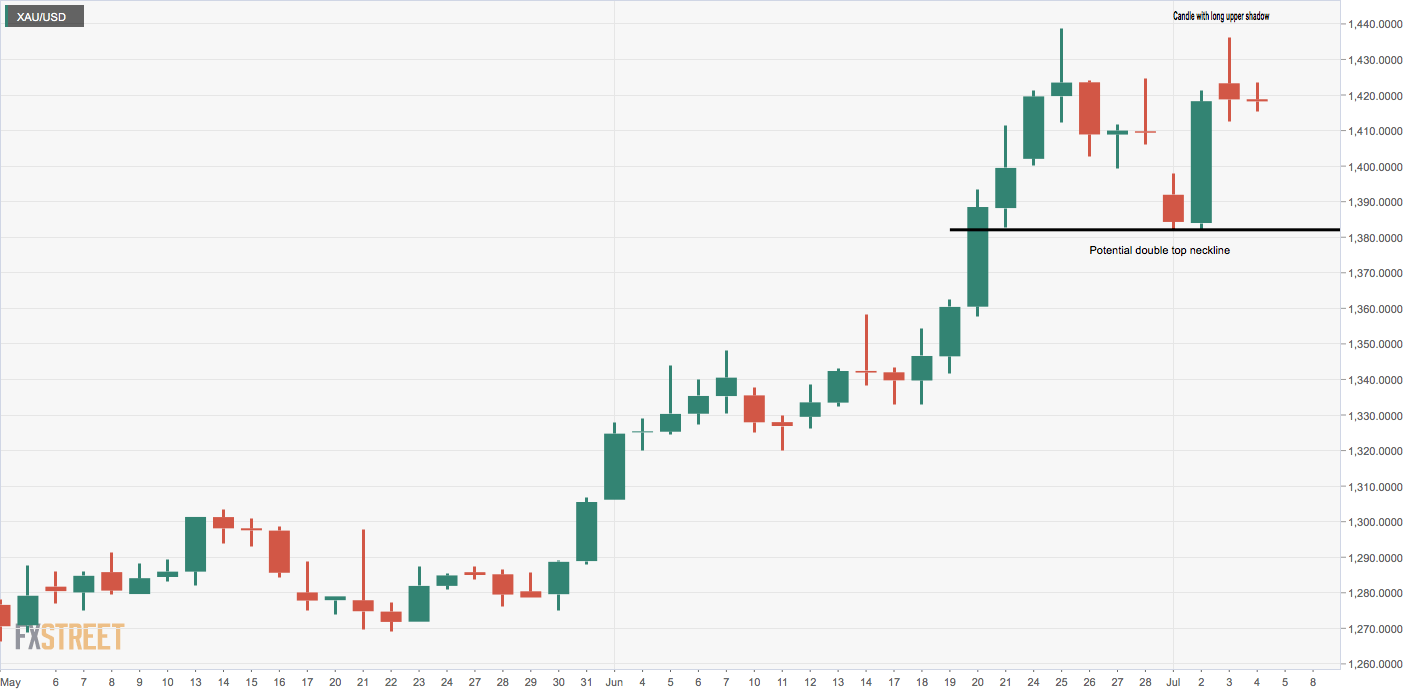
- Daily chart shows buyer exhaustion.
Gold is struggling to shine this Thursday morning in Asia despite the bullish technical setup on short duration chart.
The yellow metal’s hourly chart shows a bull flag breakout – a continuation pattern which often accelerates the preceding bullish move.
Even so, gold is trading largely unchanged on the day at $1,418.
The metal’s inability to rally despite the flag breakout on the hourly chart validates the signs of buyer exhaustion on the daily chart.
The safe haven metal spiked to $1,438 levels in the Asian trading hours yesterday only to end the day with moderate losses at $1,419. Essentially, the metal created a candle with a long upper shadow. A similar candle was created on June 25 as well.
As a result, the yellow metal looks set to retest the psychological support of $1,400. That said, a bearish reversal would be confirmed only if the price drops below $1,382, confirming a double top breakdown.
Hourly chart
Daily chart
Trend: Pullback to $1,400 likely
Pivot points