8 Jul 2019
Gold technical analysis: Forming a double top?
- Gold is creating a double top on the daily chart.
- A break below $1,382 would confirm double top breakdown.
Gold is currently trading just below $1,400, having faced rejection near $1,440 twice in the last two weeks.
The yellow metal seems to have created a double top pattern on the daily chart.
A close below $1,382 (July 1 low & double top neckline) would confirm a double top breakdown – a bullish-to-bearish reversal – and open the doors to $1,326 (target as per the measured move method).
A breakdown looks likely as the odds of aggressive Federal Reserve easing have dropped following Friday’s upbeat monthly non-farm payrolls data.
The prospects of a double top breakdown, however, would weaken if the metal rises above Friday’s high of $1,424.
Daily chart
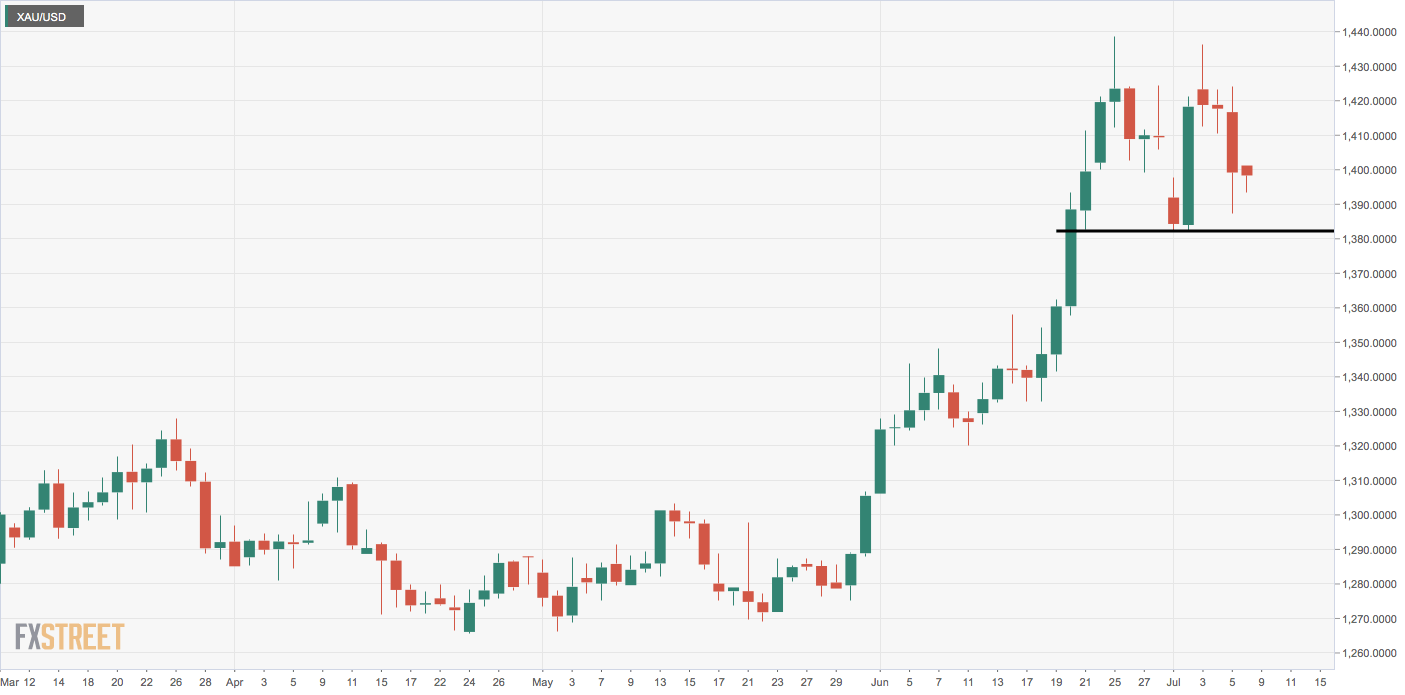
Trend: Bearish below $1,382
Pivot points