8 Aug 2019
GBP/USD technical analysis: Cable drops to 3-day lows challenging the 1.2100 handle
- GBP/USD is weakening as the US Dollar is having a modest uptick.
- The levels to beat for sellers are seen at 1.2082 and 1.2060 supports.
GBP/USD daily chart
Cable is under heavy selling pressure near multi-month lows as the market is dropping below its main daily simple moving averages (DSMAs).

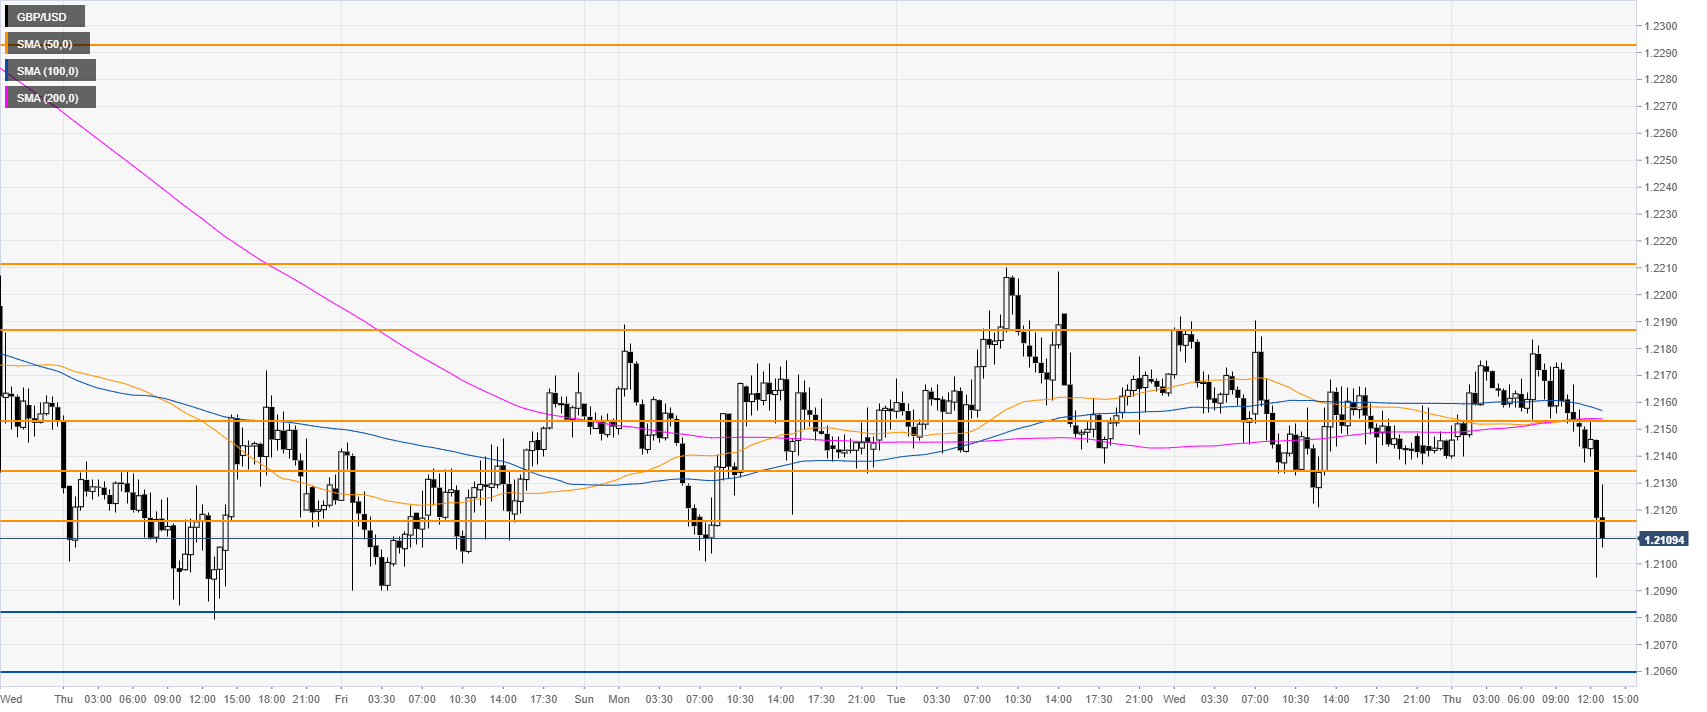
GBP/USD 4-hour chart
GBP/USD is trading below its main SMAs, suggesting bearish momentum in the near term. Bears broke below 1.2116 support, opening the doors to further losses towards 1.2082, 1.2060, 1.2035 and the 1.2000 figure, according to the Technical Confluences Indicator.

GBP/USD 30-minute chart
Cable is trading at fresh 3-day lows below its main SMAs, suggesting further weakness in the short term. Immediate resistance can be seen near 1.2116, 1.2154, 1.2186 and the 1.2212 levels.
Additional key levels