13 Aug 2019
GBP/JPY technical analysis: Upside capped by 50-hour EMA, 3-day long resistance-line
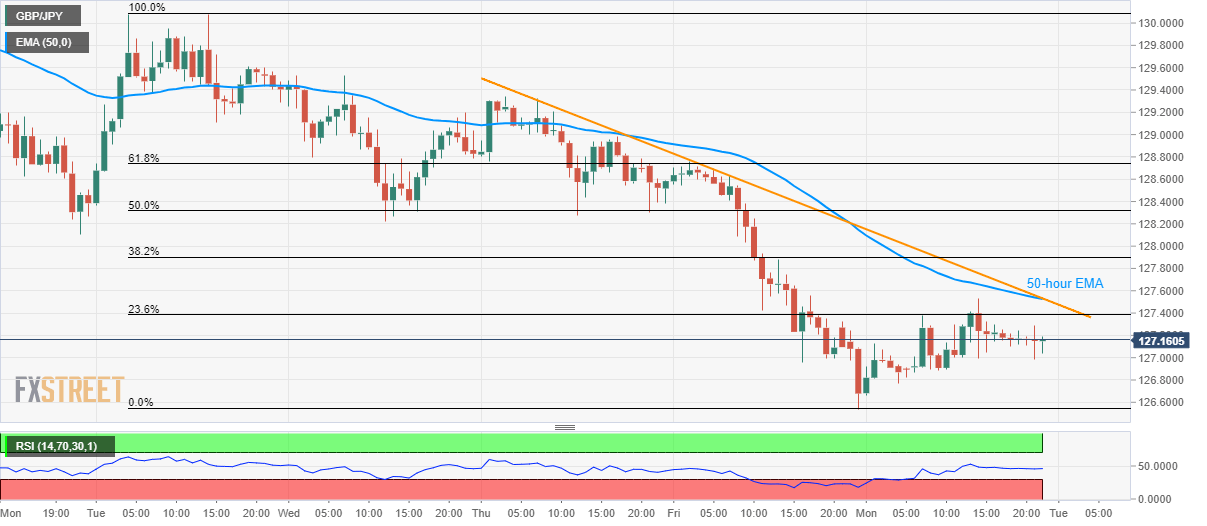
- GBP/JPY holds tightly between 127.00 and 127.30.
- Upside capped by 50-hour EMA and immediate descending trend-line.
- Downside break can recall 2017 low.
Despite bouncing off 126.54, GBP/JPY fails to register much upside as it trades near 127.15 during early Tuesday morning in Asia.
While the year 2017 low surrounding 125.62 becomes the next downside support after 126.54, buyers can enter if the pair rises past-127.52/53 confluence including 50-hour exponential moving average (EMA) and a downward sloping trend-line since August 08.
In doing so, 128.22 and 61.8% Fibonacci retracement level near 128.74 can become the bull’s favorite ahead of aiming for August 08 high near 129.34 and the 130.00 round-figure.
GBP/JPY hourly chart
Trend: Sideways