
9 Sep 2019
USD/JPY technical analysis: Greenback holding above the 107.00 handle against the Yen
- USD/JPY holds on to modest intraday gains this Monday.
- The levels to beat for bulls is the 170.25 resistance, according to the Technical Confluences Indicator.
USD/JPY daily chart
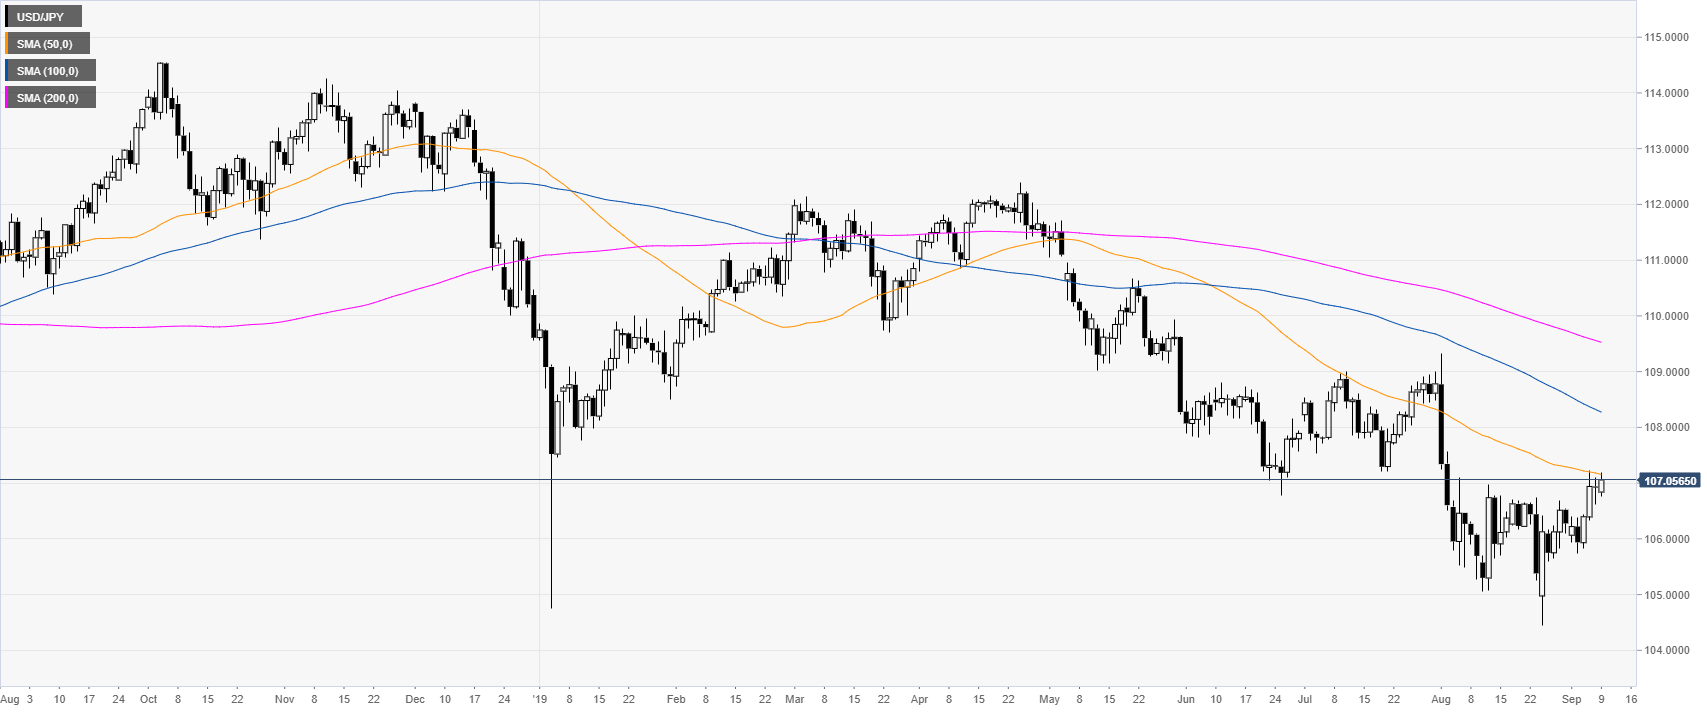
USD/JPY is trading in a bear trend below the main daily simple moving averages (DSMAs). The market is testing the 107.00 figure and the 50 SMA on the daily time-frame.
USD/JPY 4-hour chart
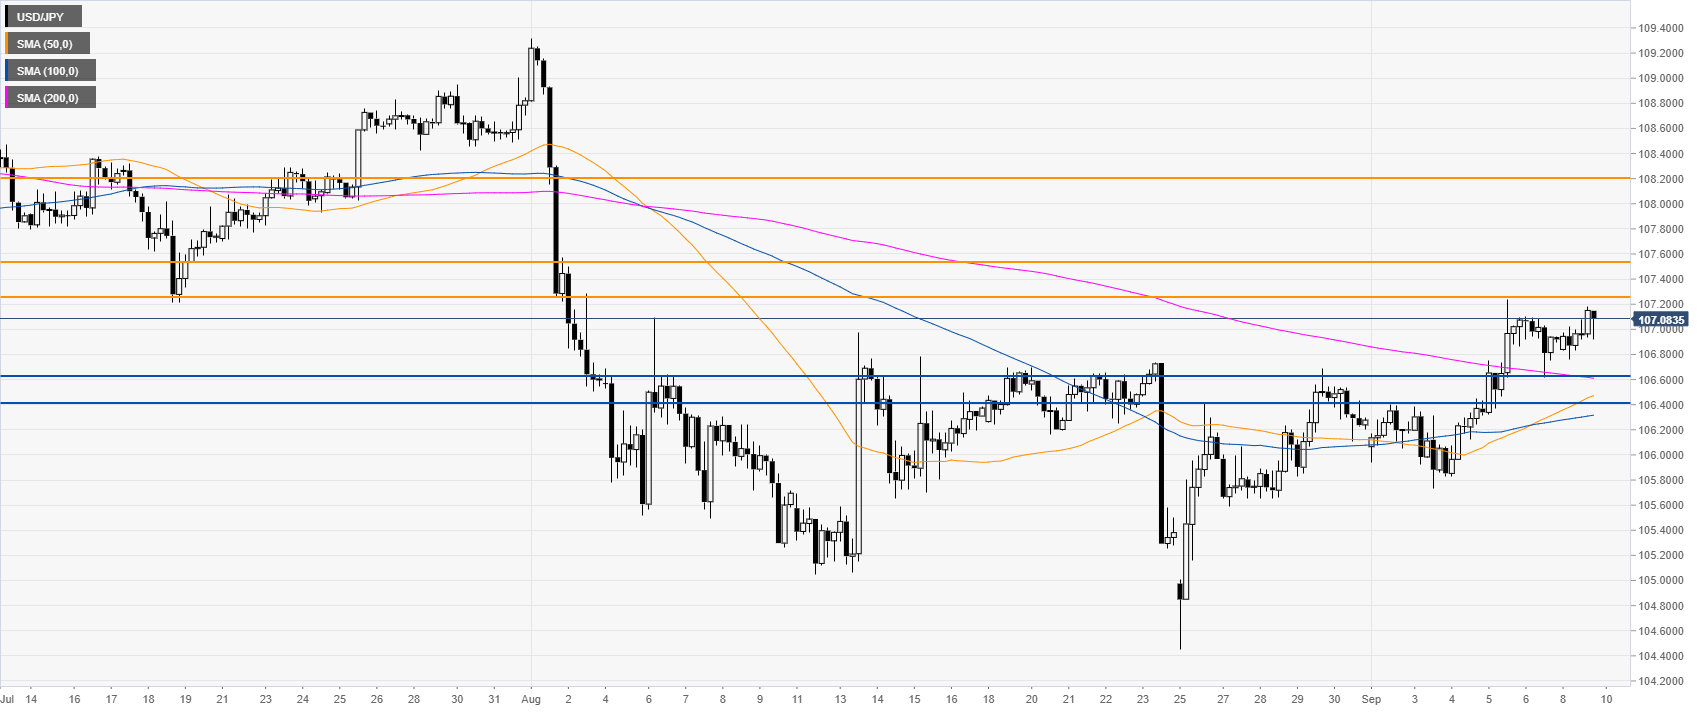
USD/JPY is trading above the main SMAs, suggesting bullish momentum in the medium term. Bulls’s objective is to break beyond 107.25 resistance on a daily closing basis. Further up resistances are seen at 107.53 and 108.20 price levels, according to the Technical Confluences Indicator.
USD/JPY 30-minute chart
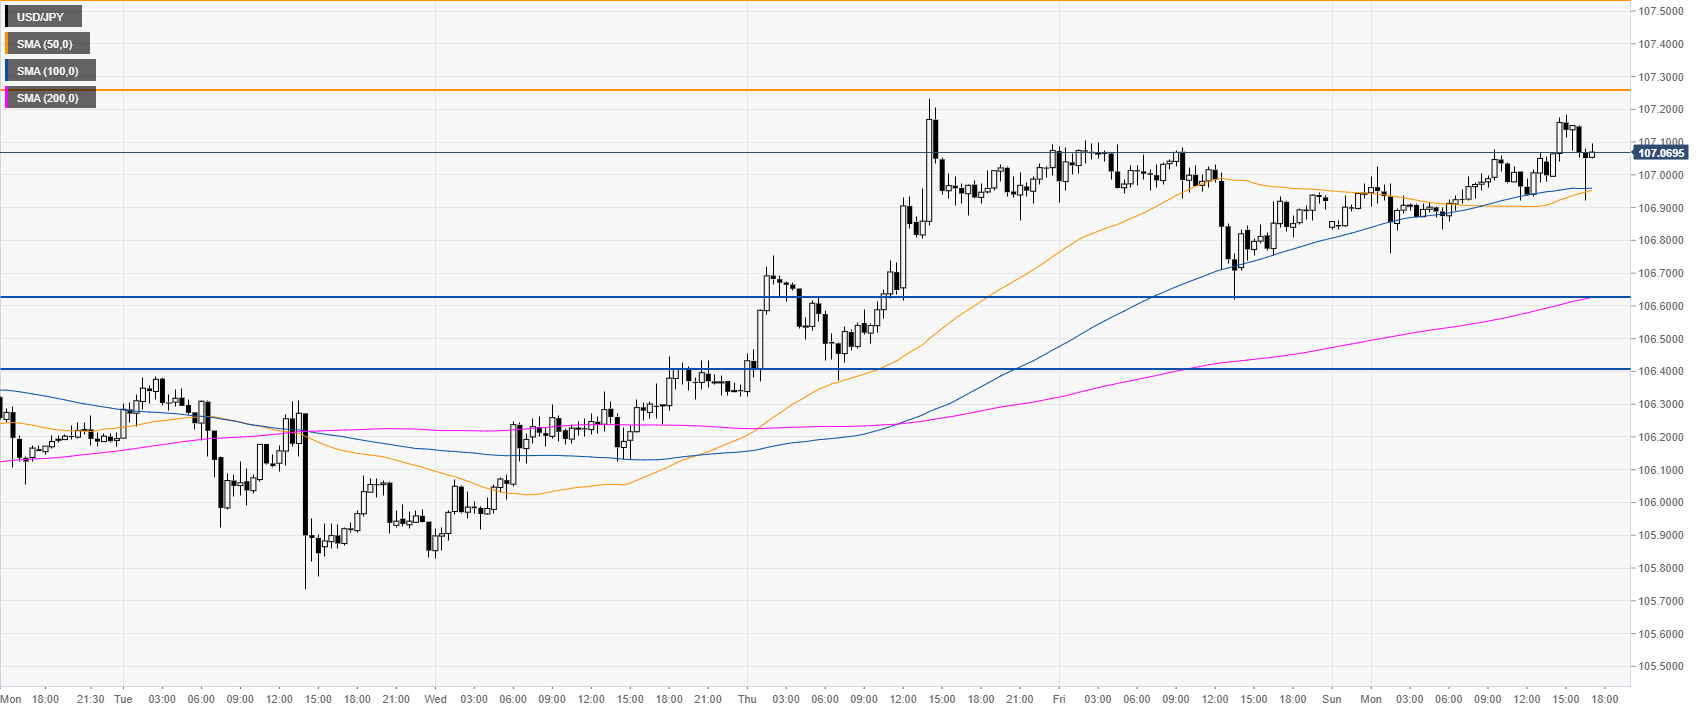
Dollar/Yen is trading above its main SMAs, suggesting bullish momentum in the near term. Support is seen at 106.62. However, a daily close below that level would be seen as negative for USD/JPY. Further down lies 106.40 support, according to the Technical Confluences Indicator.
Additional key levels