13 Sep 2019
USD/JPY technical analysis: Break of 100-DMA, 3.5-month-old trend-line favors further upside
- USD/JPY takes the bids towards 50% Fibonacci retracement level.
- Overbought RSI conditions could raise barriers during further advances.
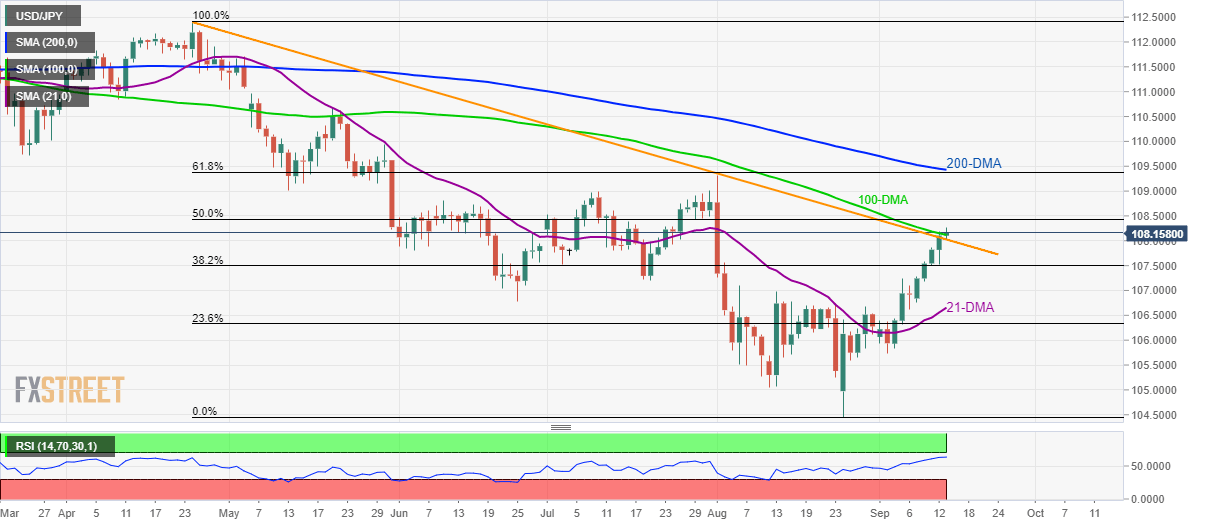
USD/JPY surges to 108.15, backed by successful break of 100-day simple moving average (DMA) and a falling trend-line since late-April, amid initial Friday trading.
The pair now aims for 50% Fibonacci retracement of April-August declines, at 108.45. However, overbought conditions of 14-day relative strength index (RSI) could question pair’s extra upside.
In a case buyers ignore overbought RSI, 109.32/43 area including August high, 61.8% Fibonacci retracement and 200-DMA becomes the key to watch.
Meanwhile, a downside break below previous resistance, at 108.00, can trigger fresh declines to 38.2% Fibonacci retracement level of 107.50 whereas 21-DMA at 106.65 could keep additional declines limited.
USD/JPY daily chart
Trend: bullish