16 Sep 2019
US Dollar Index technical analysis: DXY strengthens at the start of the week, trading above 98.55
- DXY (US Dollar Index) is regaining some strength at the start of the new week.
- The level to beat for bulls is the 98.68 and 98.10 resistance levels.
- The FOMC on Wednesday will be capital for the US Dollar.
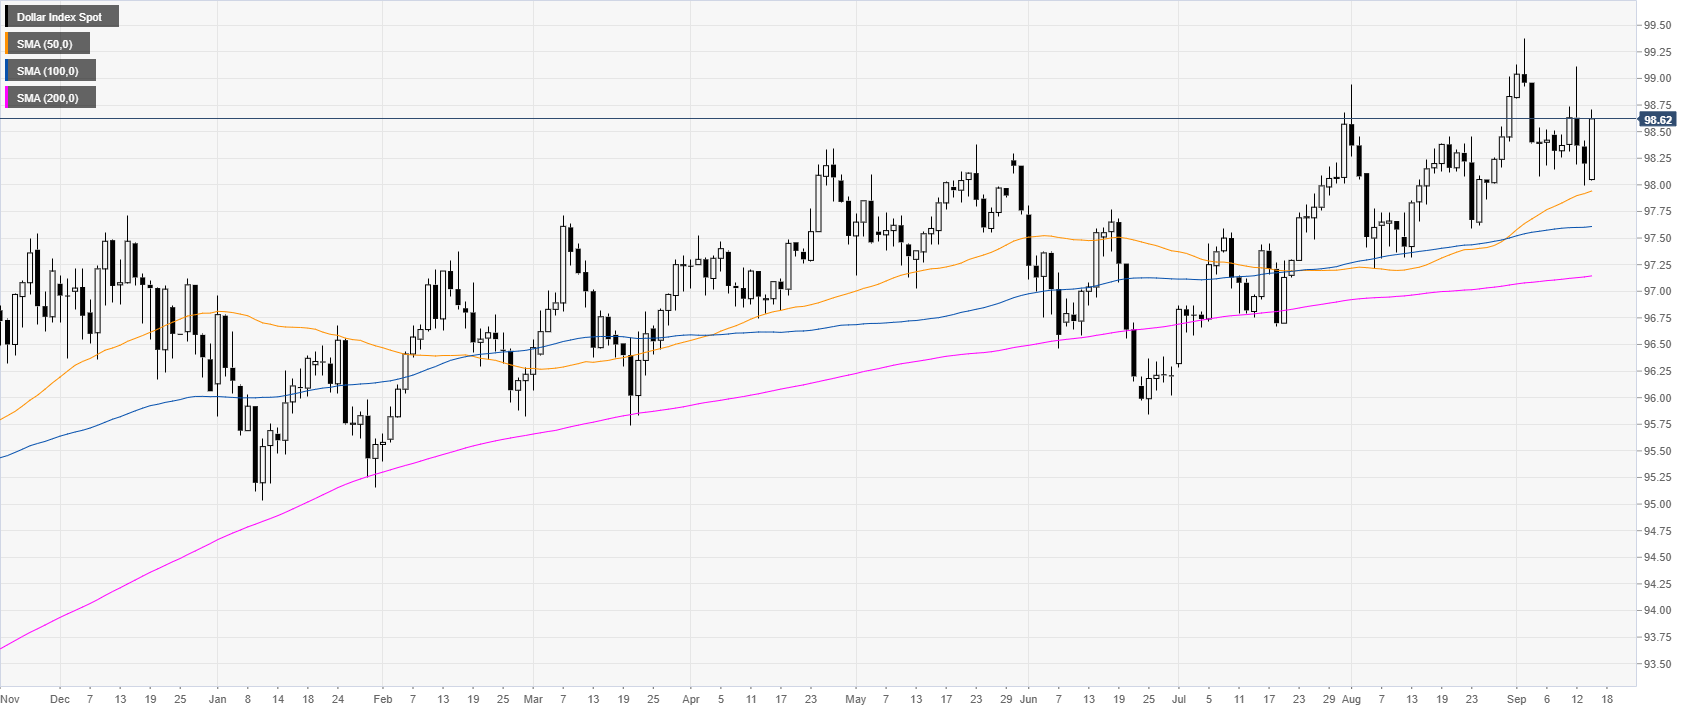
DXY daily chart
DXY (US Dollar Index) is trading in a bull trend above the main daily simple moving averages (DSMAs). The Greenback is regaining some strength in a risk-off environment. Traders will closely be watching the FOMC on Wednesday.
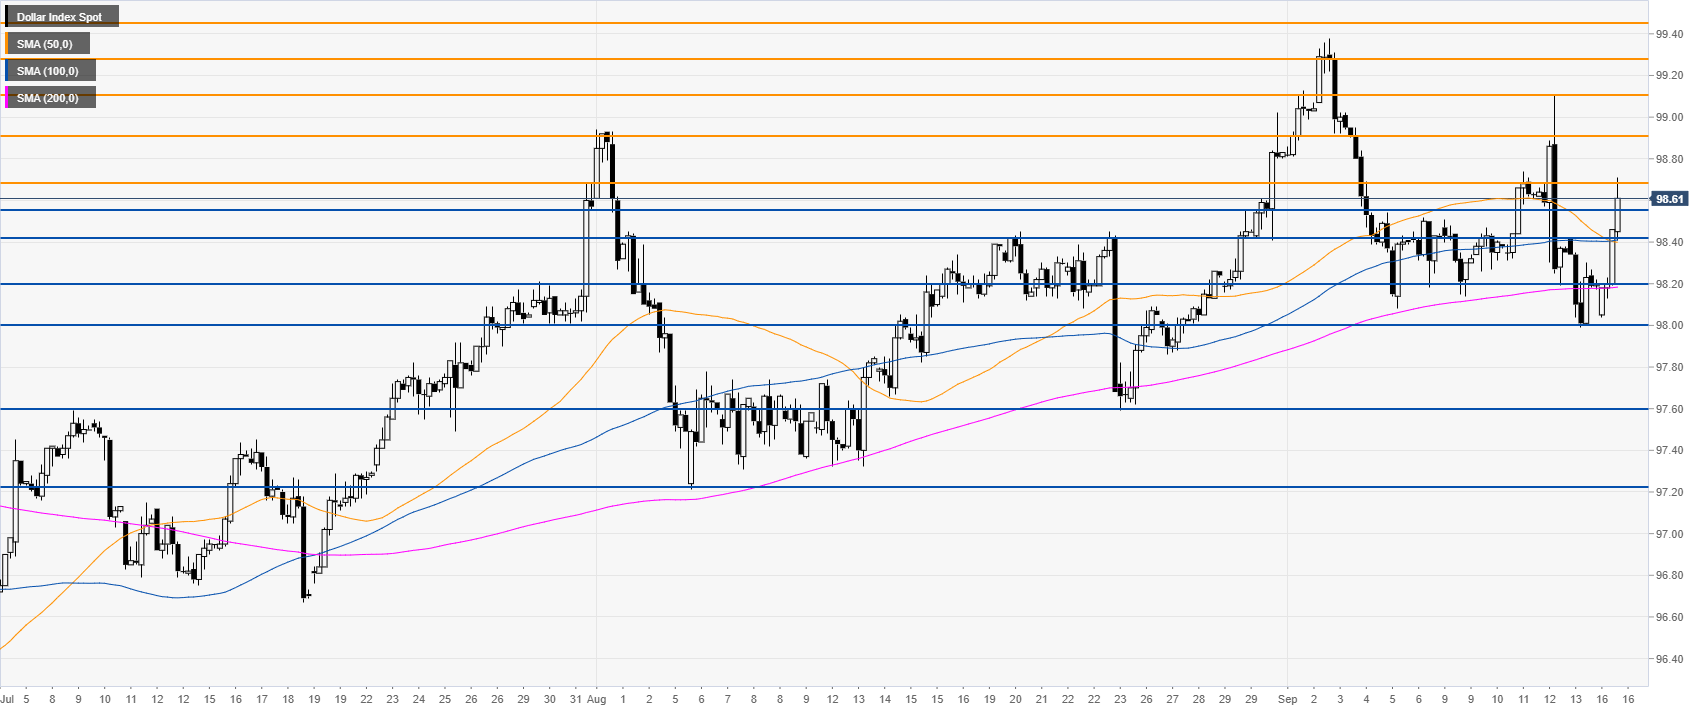
DXY four-hour chart
DXY is trading above the main SMAs, suggesting bullish momentum in the medium term. Bulls have regained several levels of resistance at the 98.42 and 98.55 price levels. Further up lies 98.68 and most importantly, 99.10, which is likely going more challenging to go through.
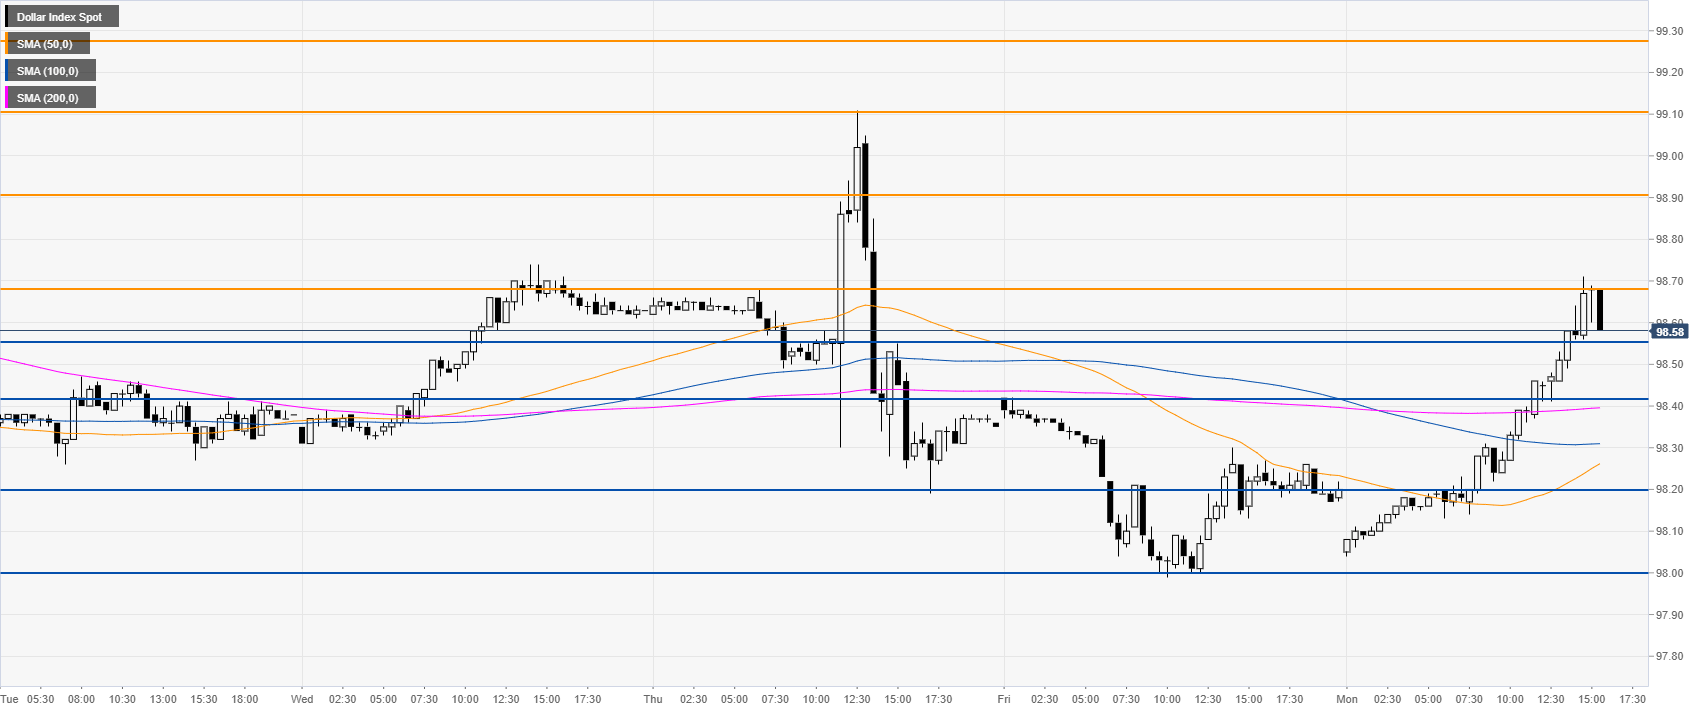
DXY 30-minute chart
DXY is trading above the main SMAs, suggesting a bullish bias in the near term. Immediate support can be found near 99.55 and 98.42 levels.
Additional key levels