2 Nov 2019
AUD/USD technical analysis: Aussie ends the week in the green above the 0.6900 handle.
- The Aussie is clinging to weekly gains ending Friday above the 0.6900 handle.
- The level to beat for bulls is the 0.6933 resistance level.
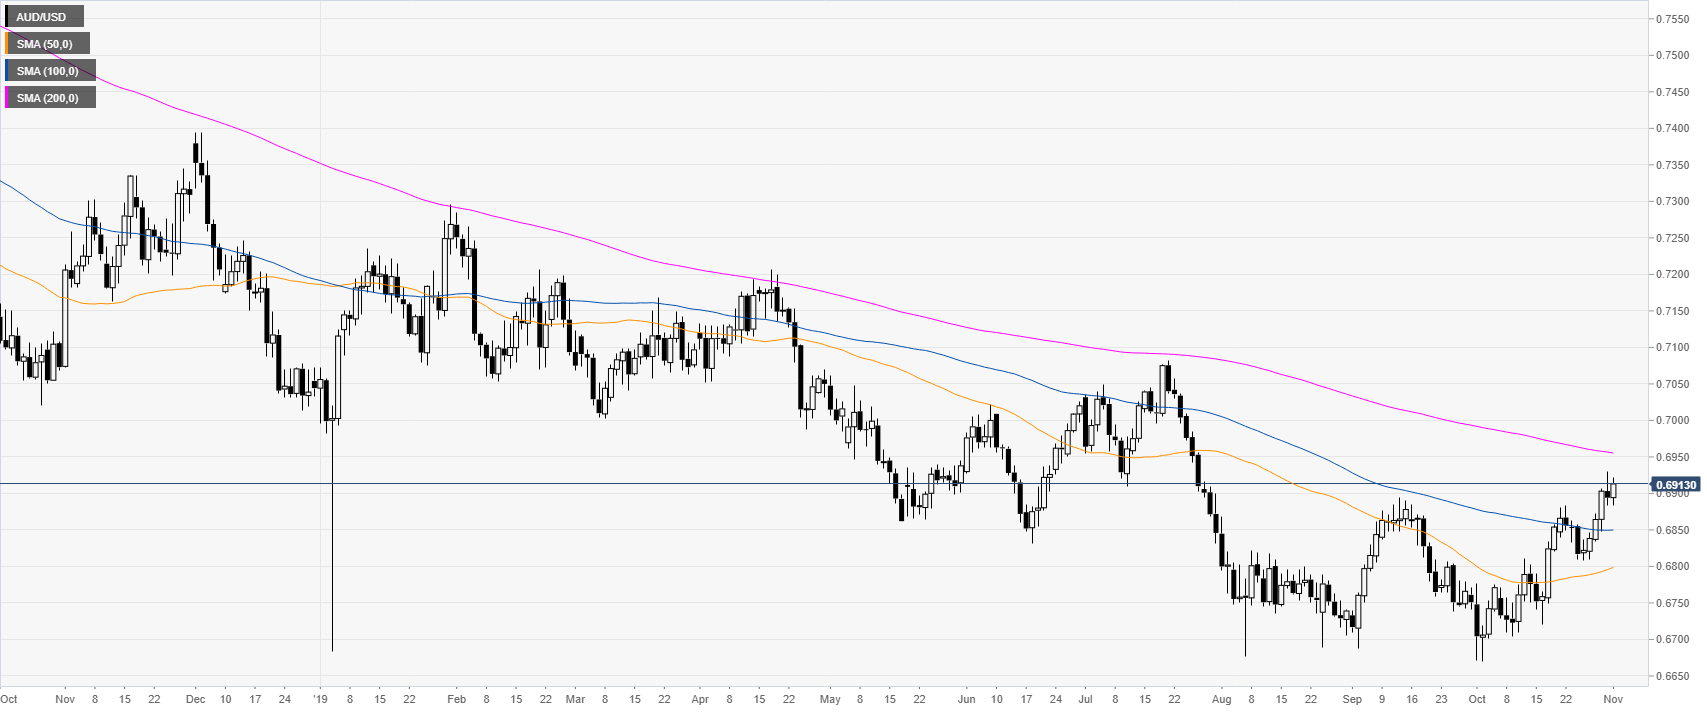
AUD/USD daily chart
The Aussie is trading in a downtrend below its 200-day simple moving average (DMA) on the daily chart. This Friday the Aussie made no significant advance while trading inside Thursday’s range.
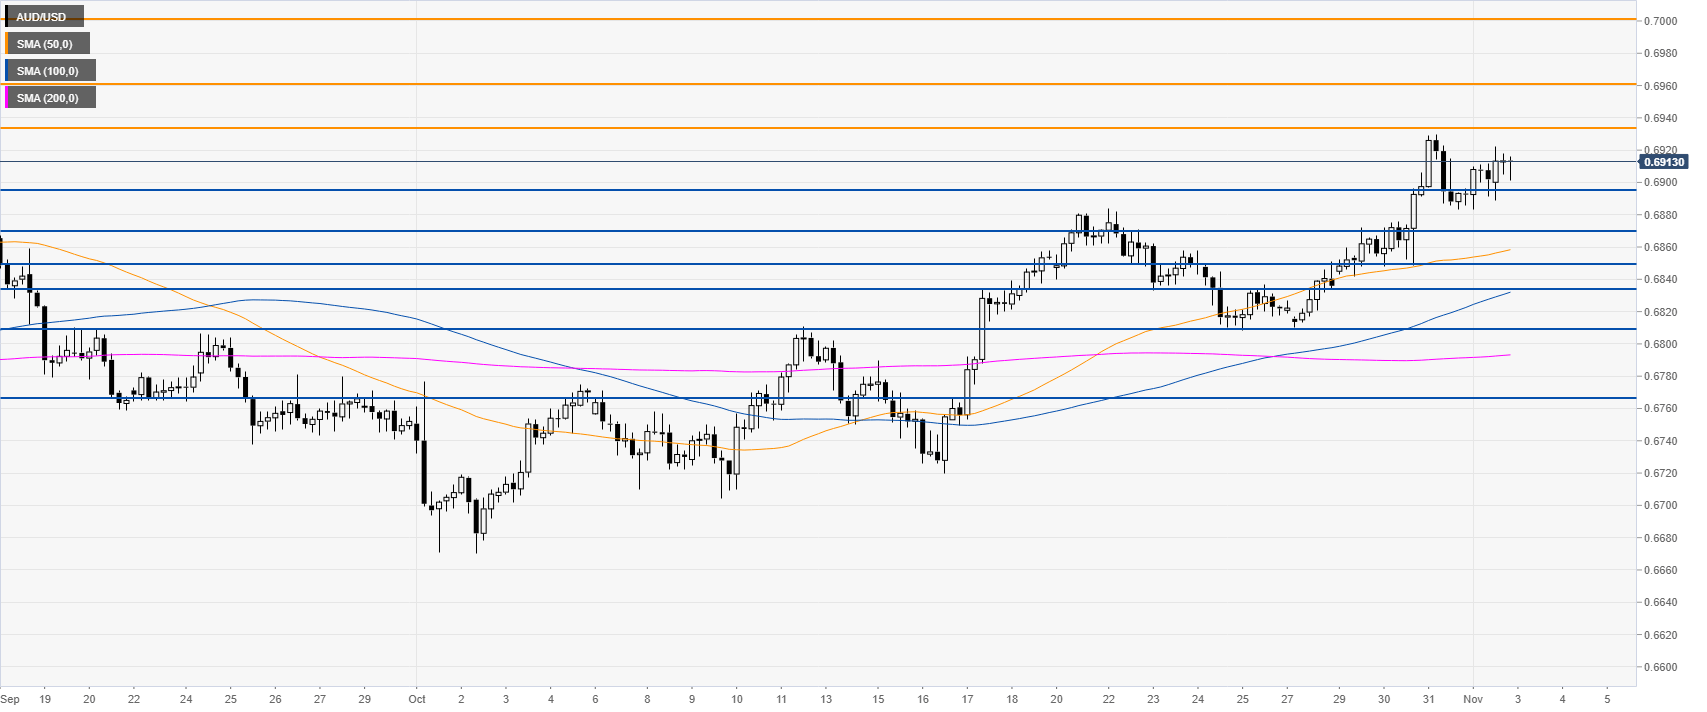
AUD/USD 4-hour chart
The market is trading above the main SMAs, suggesting a bullish bias in the medium term. The medium term bull trend remains intact with the level to beat for bulls at the 0.6933 level followed by 0.6960 and the 0.7000 handle, according to the Technical Confluences Indicator.
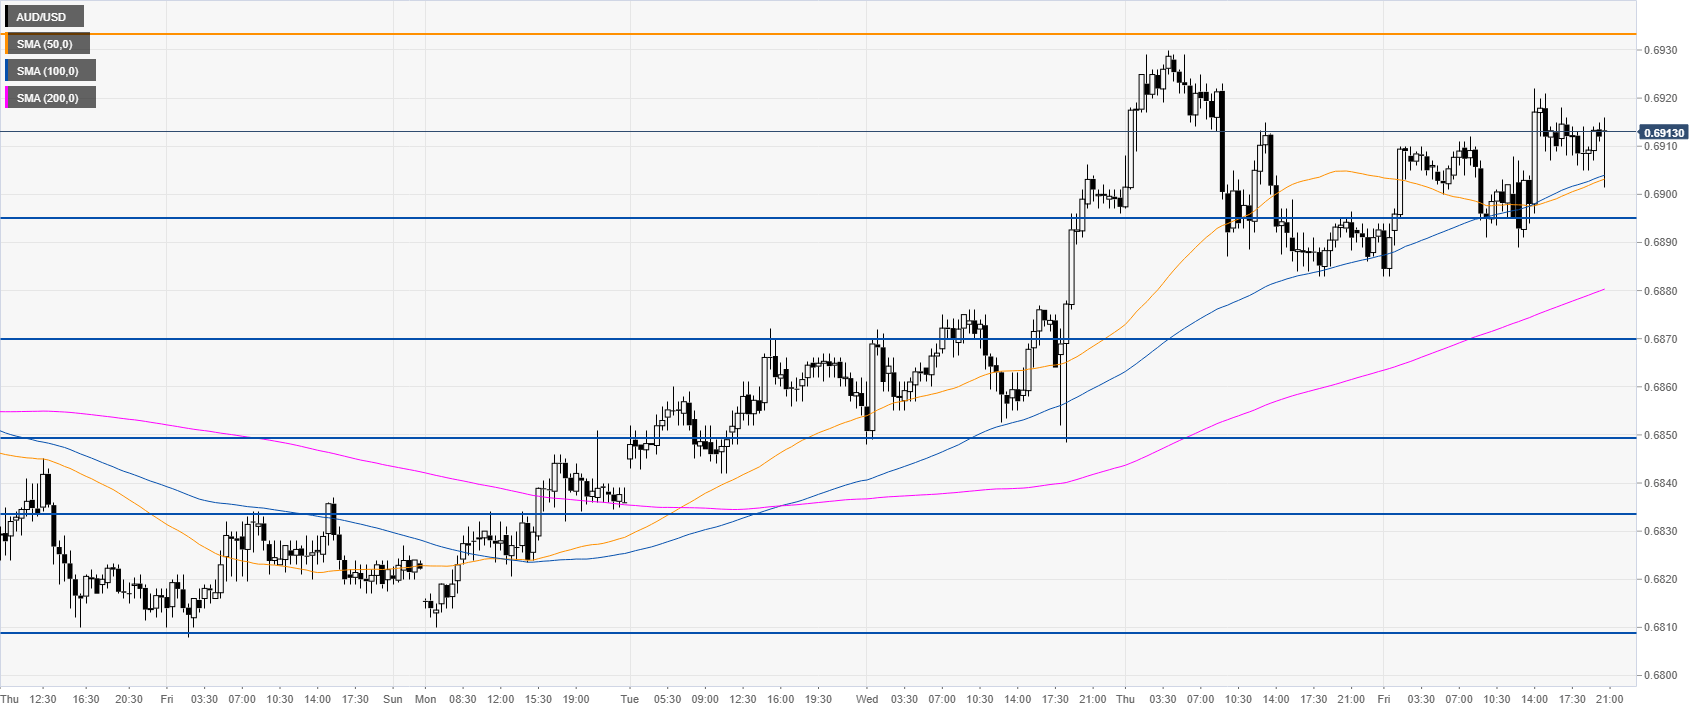
AUD/USD 30-minute chart
The spot is trading above its main SMAs, suggesting a bullish bias in the near term. Support is seen at 0.6895, 0.6870 and 0.6850 price level.
However, a daily close below the 0.6850 might mean a potential slowdown in the bull trend.
Additional key levels