4 Nov 2019
US Dollar Index technical analysis: DXY consolidates last week’s losses, holds above 97.20 level
- Despite a modest bounce, on a medium term basis, the US Dollar Index (DXY) remains under bearish pressure at the start of the week.
- The level to beat for bears is the 97.20 support.
- Resistance is seen at the 97.45 level.
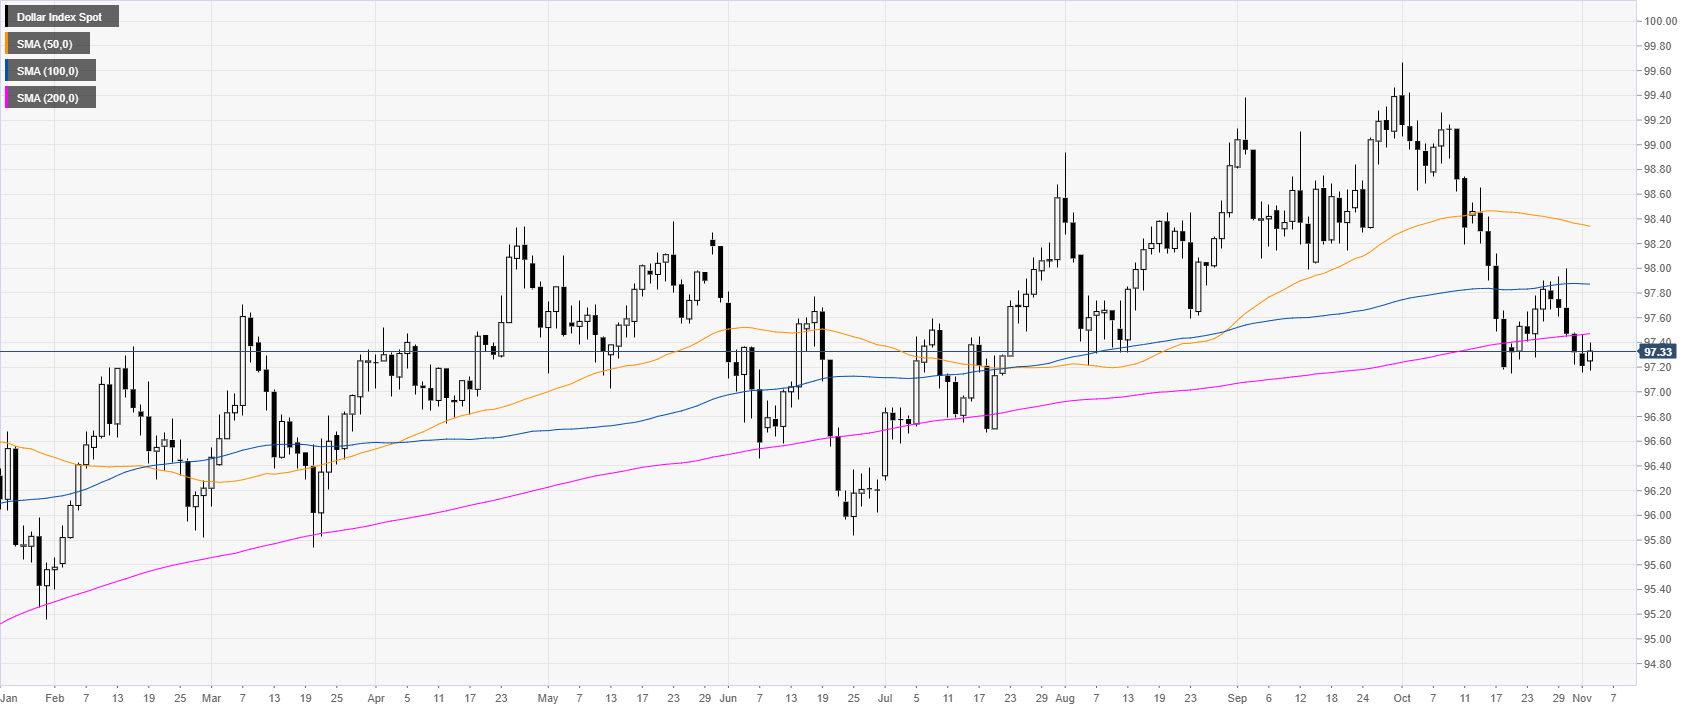
DXY daily chart
DXY is trading near 3.5-month lows below its main SMAs. This Monday the Index is holding just above the October lows, still under heavy bearish pressure.
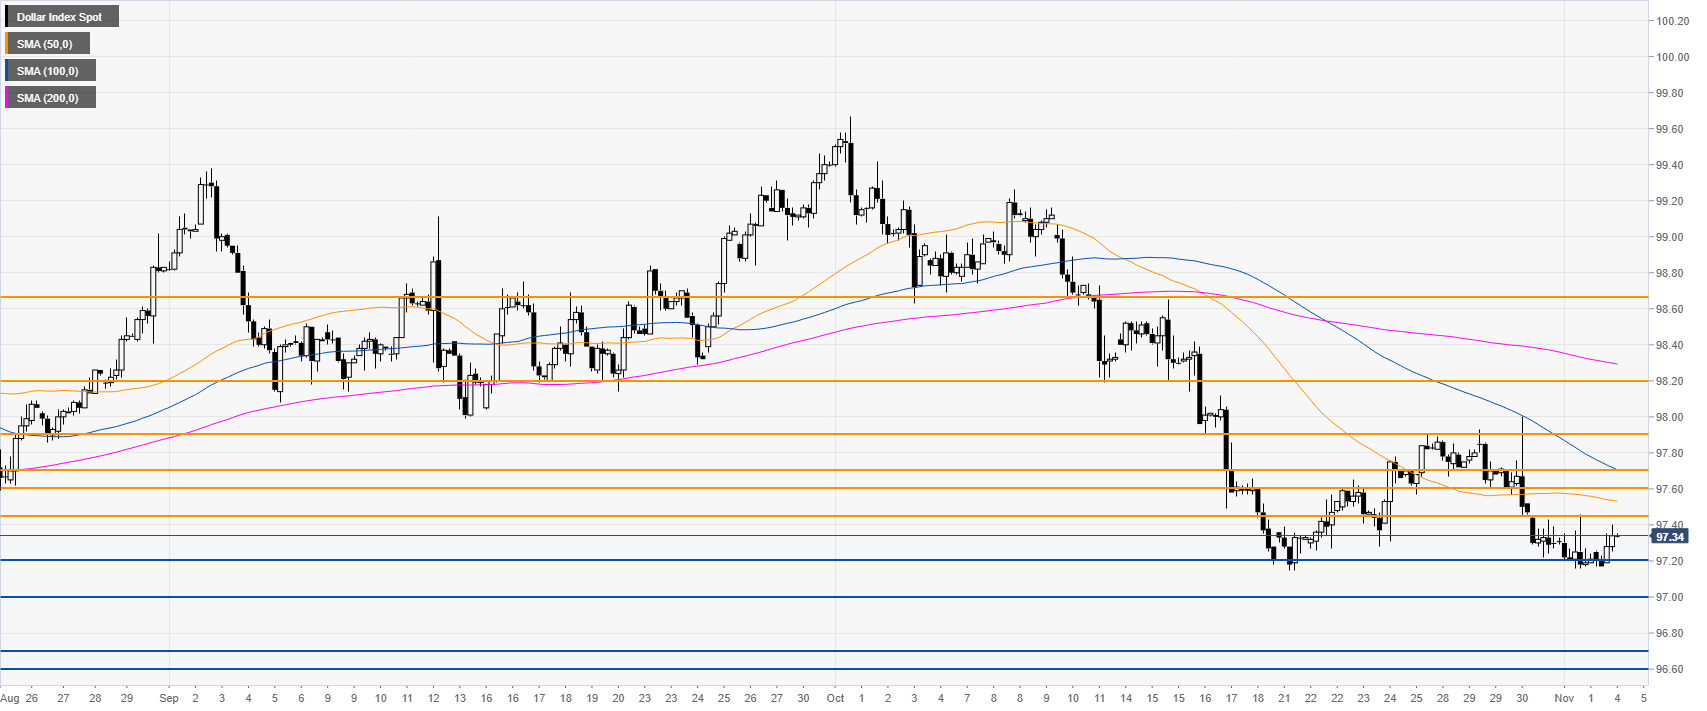
DXY 4-hour chart
The Greenback is trading below its main SMAs, suggesting bearish momentum in the medium term. A break below 97.20 can open the doors to further losses towards the 97.00 figure and the 96.60/70 support level.
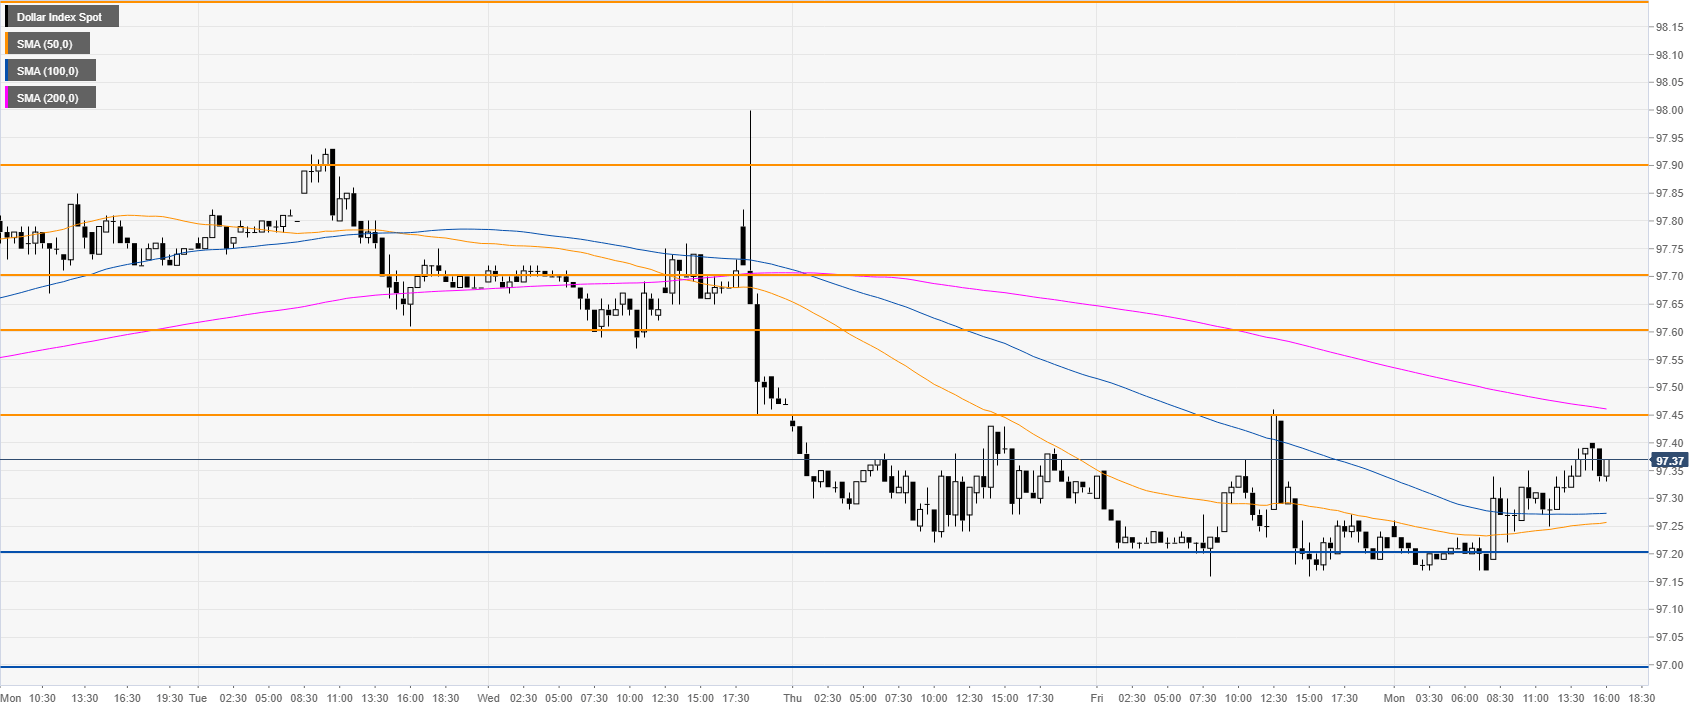
DXY 30-minute chart
DXY is starting the week with a mild bounce from the 97.20 level, trading now above its 50 and 100 SMAs but below a downward sloping 200 SMA. Resistance is seen at 97.45 followed by 97.60/70 on the way up. A daily close above 97.45 could somewhat alleviate the bearish pressure.
Additional key levels