WTI technical analysis: Steps back from 200-day SMA, 5-week-old rising trendline
- WTI consolidates gains towards 38.2% Fibonacci retracement, 100-day SMA.
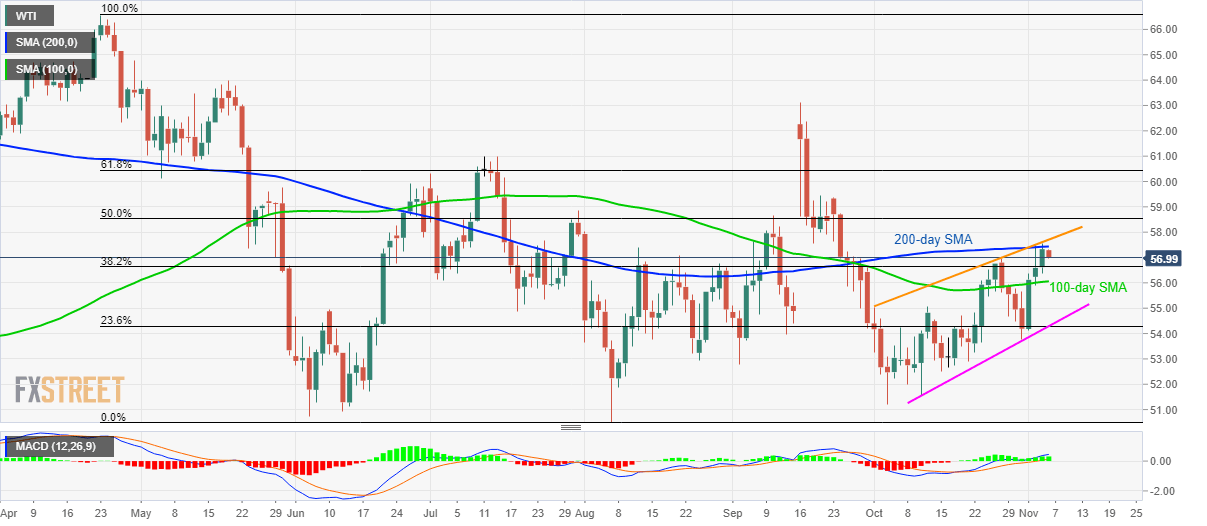
- Bullish MACD keeps buyers hopeful, key resistances limit the upside.
Following its failure to extend recent recovery beyond key upside barriers, WTI drops to $57.00 during early Wednesday.
Prices now decline towards 38.2% Fibonacci retracement of April-August downpour, near $56.60, a break of which could recall a 100-day SMA level of $56.06.
However, 23.6% Fibonacci retracement and an ascending support line since October 10, around $54.30, will restrict the black gold’s further declines.
On the upside, the 200-day Simple Moving Average (SMA) level of $57.45 and rising trend line since October 01 surrounding $57.70 can keep the energy benchmark’s rise in check.
In a case where buyers manager to dominate beyond $57.70, 50% Fibonacci retracement level of $58.55 and late-September tops near $59.50 can question additional gains ahead of flashing $60.00 on the chart.
It’s worth pointing out that 12-bar Moving Average Convergence and Divergence (MACD) keeps buyers hopeful with bullish signals.
WTI daily chart
Trend: pullback expected