8 Nov 2019
Oil technical analysis: WTI trading at weekly lows, challenging $56.00 a barrel
- Crude ends the week keeping the consolidation theme unchanged.
- The level to beat for sellers is the 56.00 figure.
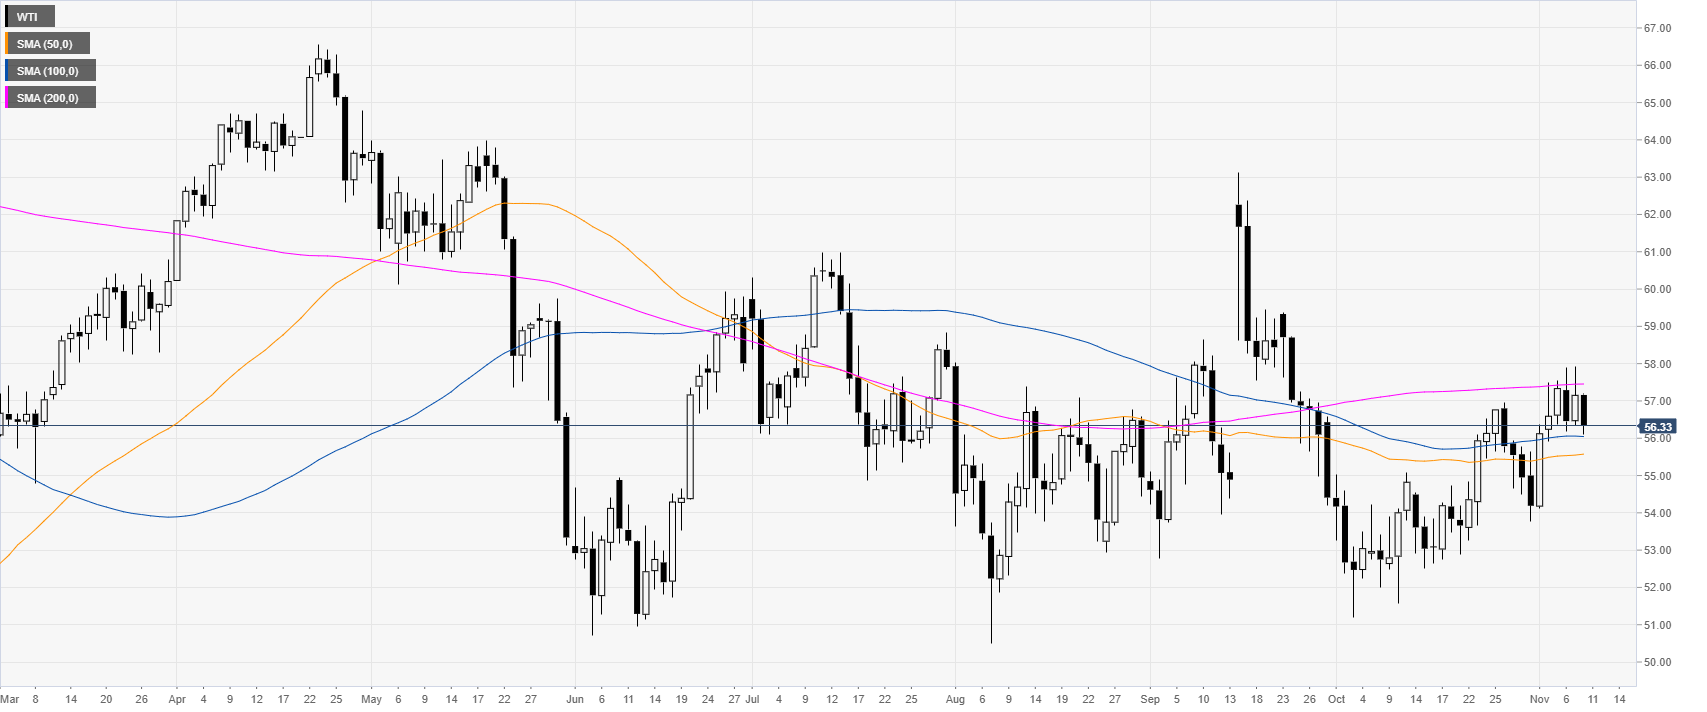
Crude oil daily chart
The crude oil West Texas Intermediate (WTI) is challenging $56.00 a barrel and the 100-day simple moving average (DMA). The market has been consolidating for the most of the week.
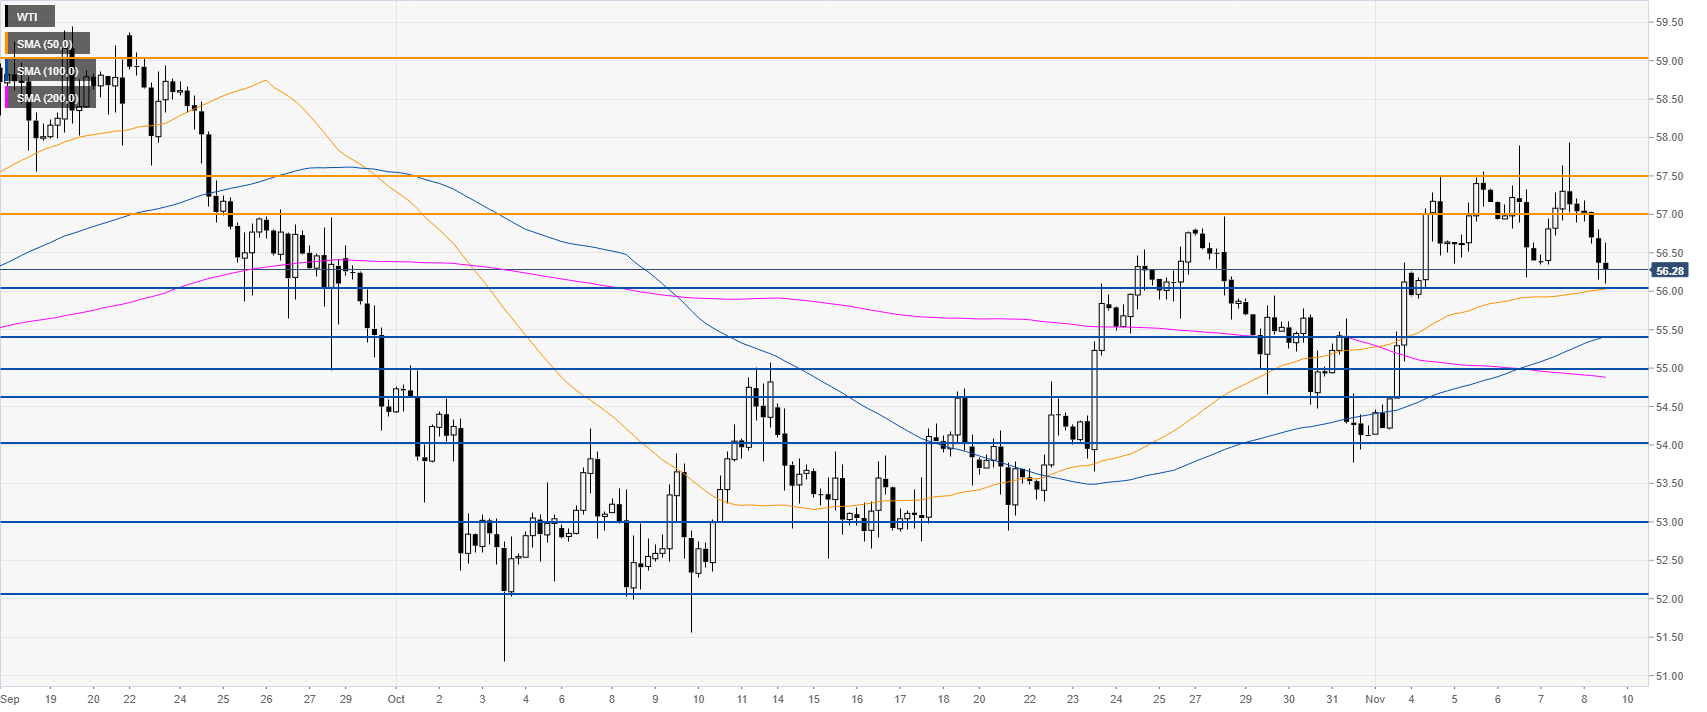
Crude oil four-hour chart
The market is ranging above its main SMAs, keeping a somewhat bullish bias above the 56.00 support level. Bulls would need a daily close above 57.50 to resume the bull move.
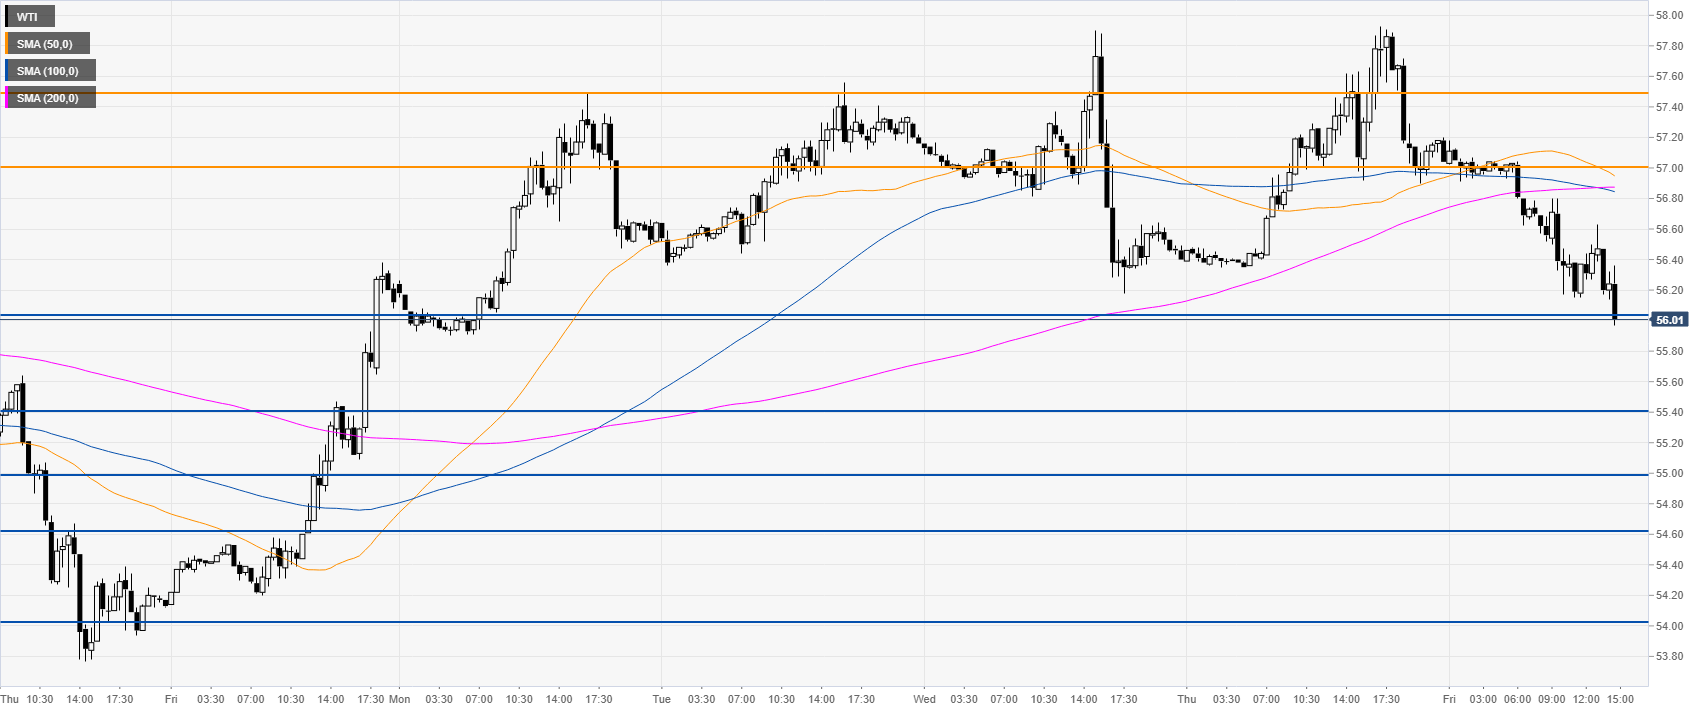
Crude oil 30-minute chart
WTI is trading below its main SMA, suggesting bearish momentum in the near term. However, sellers need to overcome the 56.00 handle. A break below the level can lead to 55.40 support and the 55.00 figure.
Additional key levels