11 Nov 2019
USD/JPY technical analysis: Greenback retreating against Yen, trades near 109.00 handle and 200 DMA
- USD/JPY is starting the week on the back foot.
- The market is challenging the 109.00 handle in the New York session.
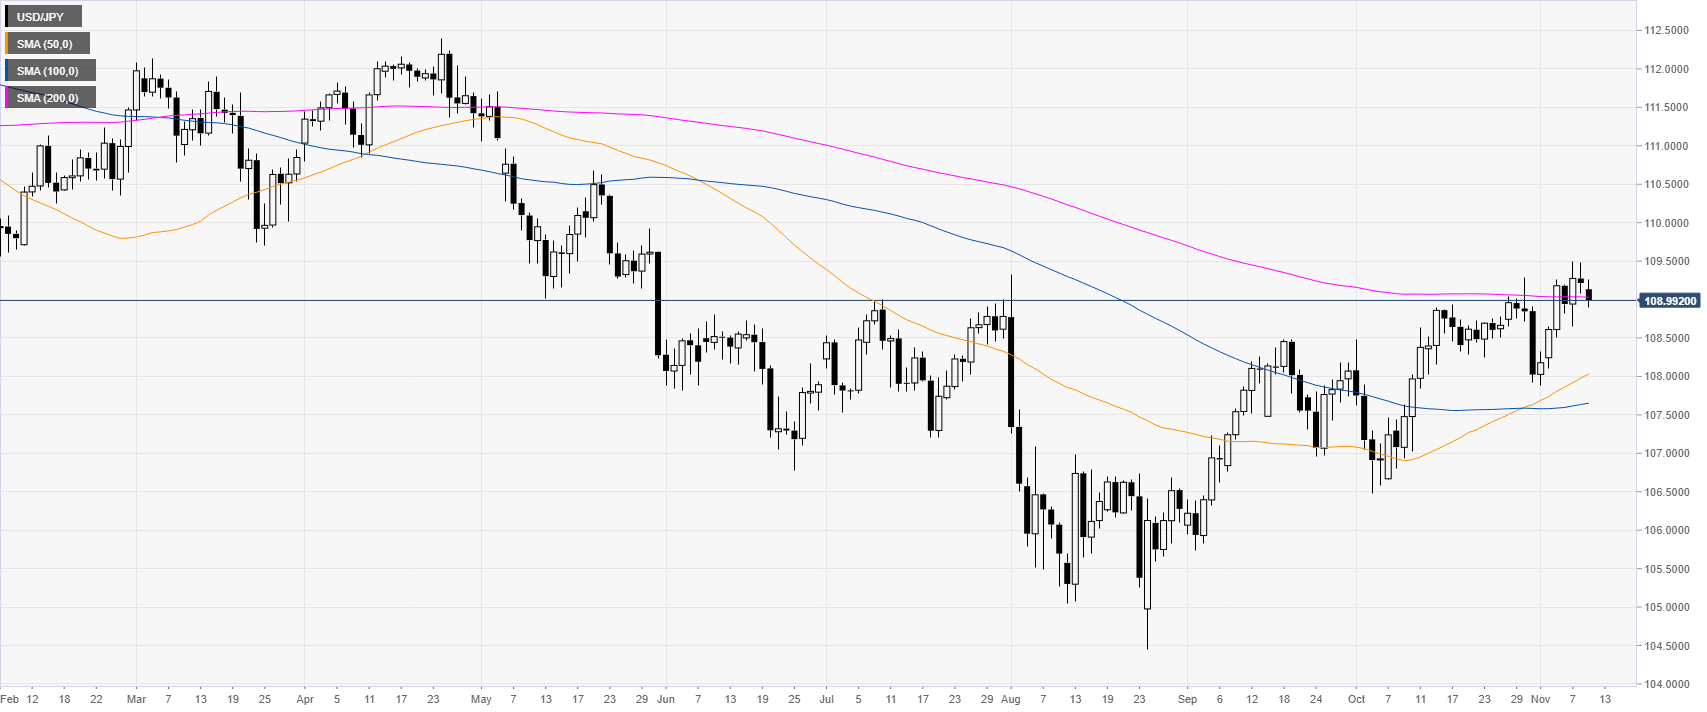
USD/JPY daily chart
USD/JPY is trading near the 109.00 handle and the 200-day simple moving average (SMA) on the daily chart. In the last two months the spot has been rising consistently suggesting potential further strength.
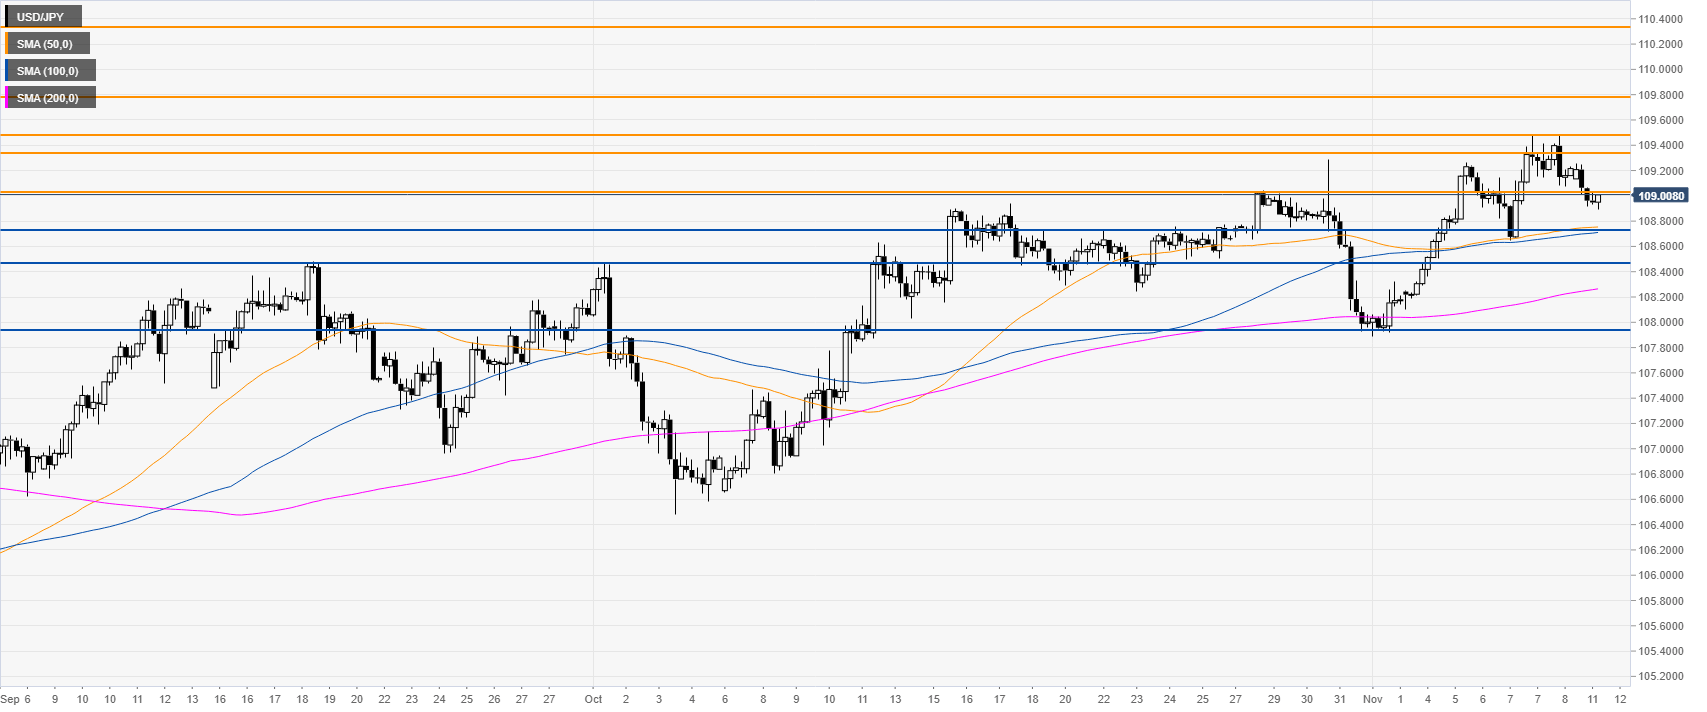
USD/JPY four-hour chart
The spot is trading above the main SMAs on the four-hour chart, suggesting a bullish bias in the medium term. The market is battling with the 109.00 handle. Resistances on the way up are seen at the 109.32/49 price zone, 109.77 level, followed by the 110.34 price level, according to the Technical Confluences Indicator.
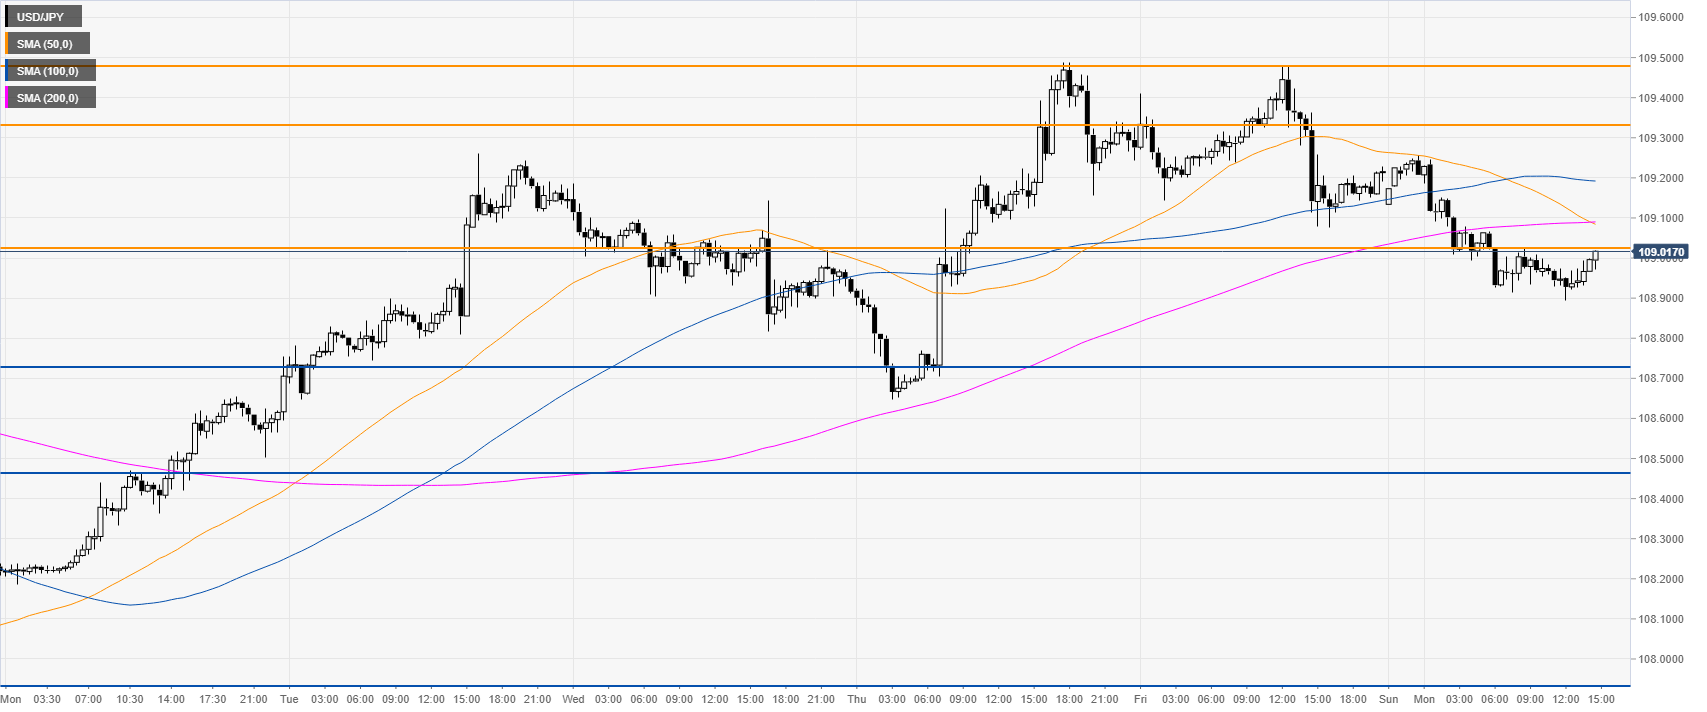
USD/JPY 30-minute chart
USD/JPY is trading below the main SMAs, suggesting a bearish momentum in the near term. Support is seen at the 108.75, 108.47 and 107.93 levels, according to the Technical Confluences Indicator.
Additional key levels