7 Jan 2020
USD/JPY Price Analysis: Greenback rolling into Asia above 108.23 vs.yen
- USD/JPY is regaining some strength while reversing up above the 108.00 handle.
- The level to beat for bulls is the 108.45/50 price zone.
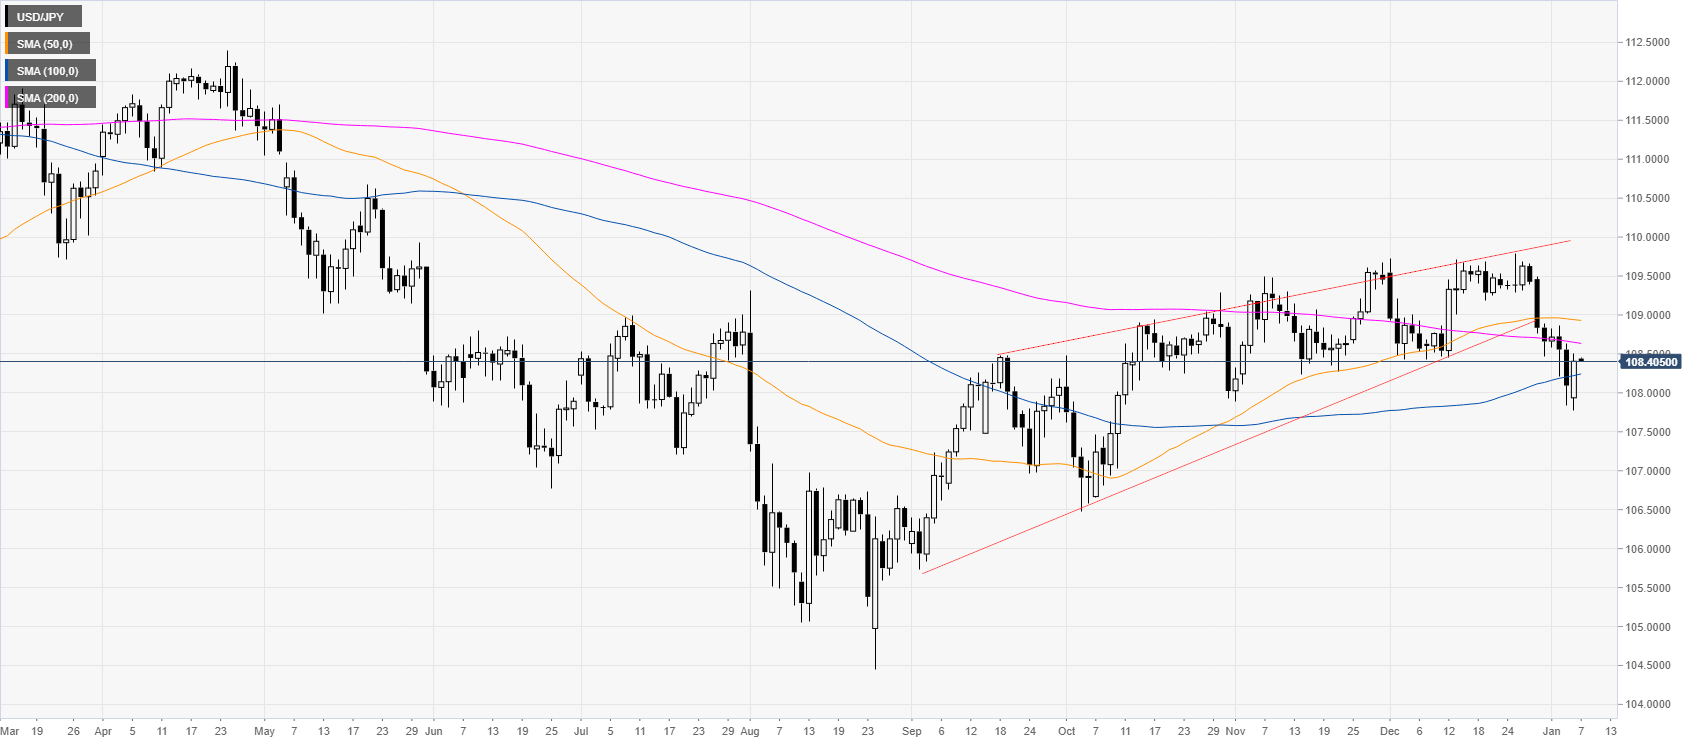
USD/JPY daily chart
USD/JPY is weakening as it fell from the December highs and is trading in the rising wedge formation. The market is trading below the 50 and 200-day simple moving averages (SMAs) while above the 108.00 handle.
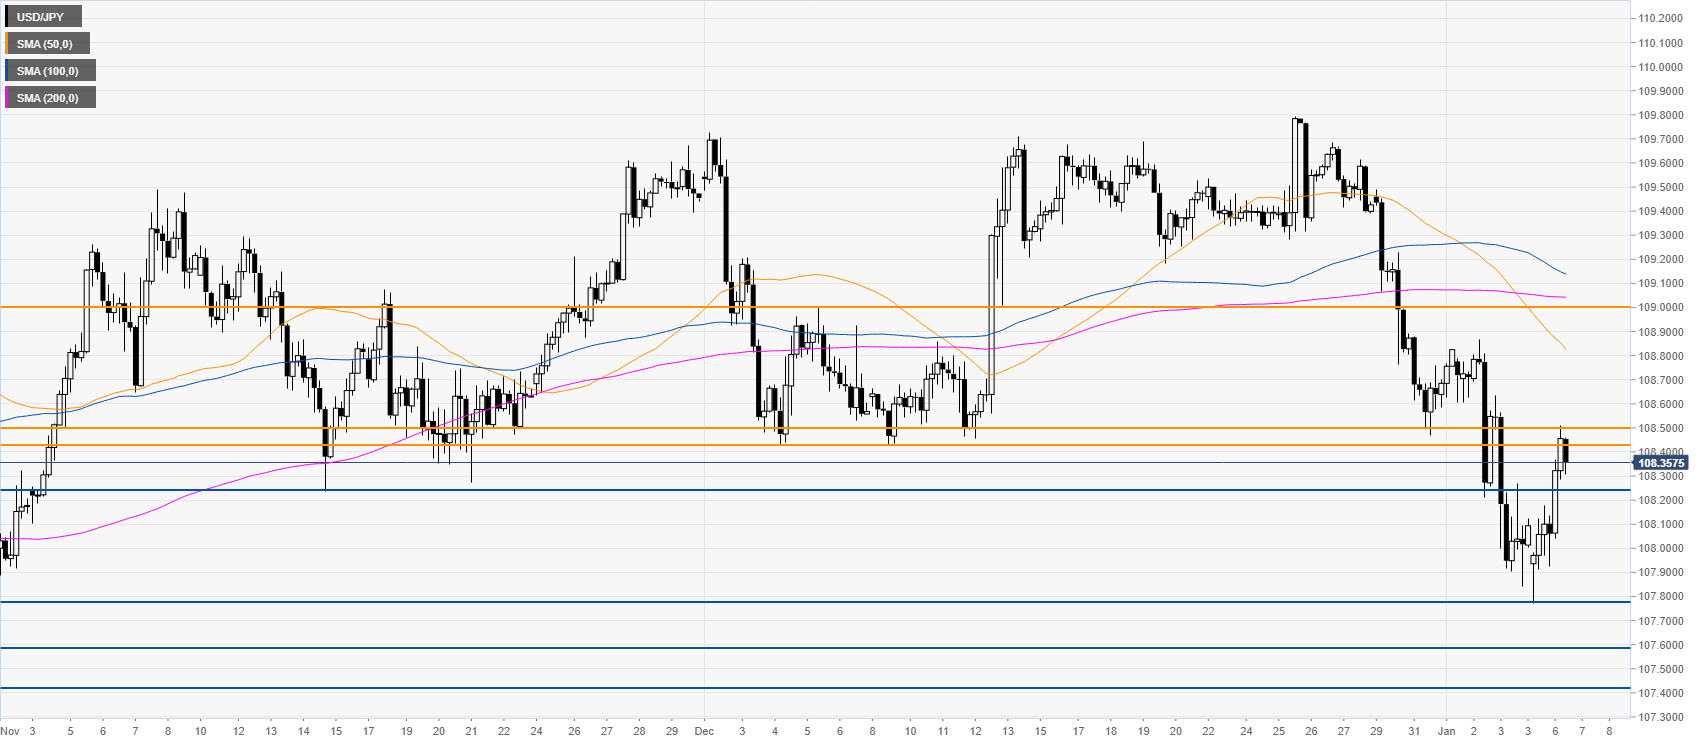
USD/JPY four-hour chart
The market is reversing up and challenging the 108.45/50 resistance zone. A break above this level can generate more gains towards the 109.00 handle. On the flip side, if bears break the 108.23 support, the market can lose its grip and decline towards the 107.78, 107.60 and 107.44 price levels, according to the Technical Confluences Indicator.
Additional key levels