NZD/USD Price Analysis: Drops to two-week low, 0.5900 in focus
- NZD/USD registers four-day losing streak.
- A two-week-old falling trend line could restrict the immediate downside.
- 200-bar SMA, 23.6% Fibonacci retracement cap recovery moves.
NZD/USD declines to two-week low while taking rounds to 0.5920, currently down 0.48% on a day with an intraday low of 0.5910, during the initial Tokyo session on Thursday.
The pair registered gains in early Asia but failed to hold them after worrisome headlines from the US Coronavirus Task Force Briefing, as well as US President Donald Trump’s threats to Iran.
Also read: NZD/USD remains choppy in a familiar territory below 0.6000
Looking forward, an immediate falling trend line since April 08, near 0.5900, seems to restrict the pair’s further downside, if not then the monthly lows near 0.5840 are likely to return on the bears’ radars.
Meanwhile, 23.6% Fibonacci retracement of the pair’s March-April upside and 200-bar SMA guards the quote’s recovery moves near 0.5980.
Also standing tall to challenge the bulls is the weekly high near 0.6090 and the monthly top surrounding 0.6130.
NZD/USD four-hour chart
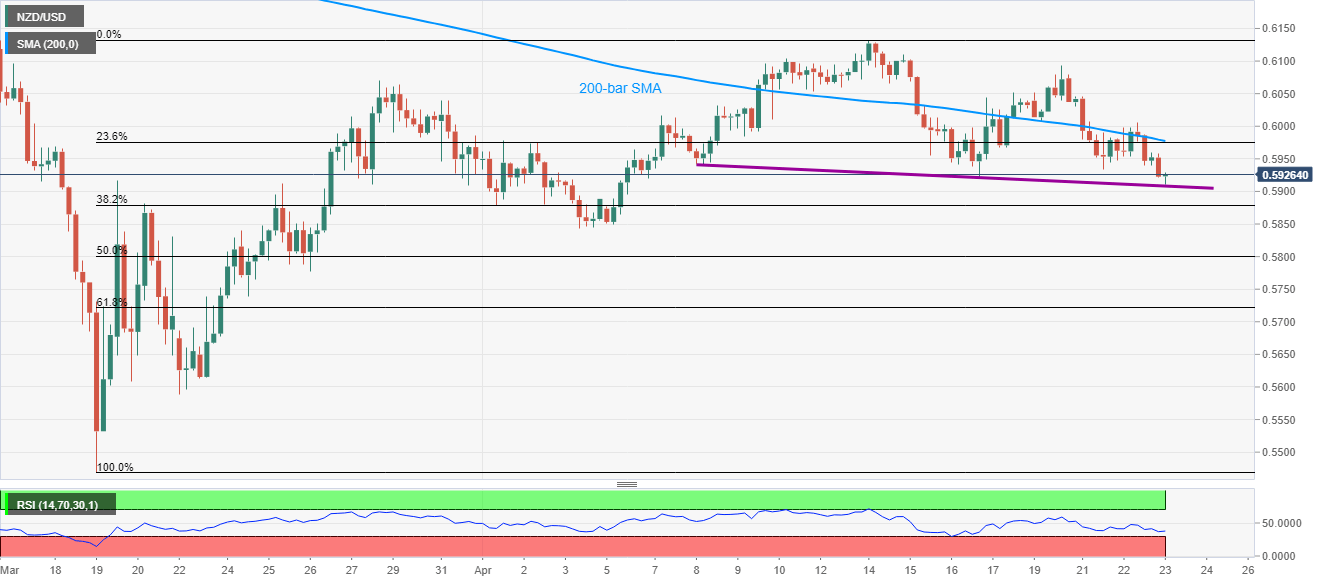
Trend: Bearish