NZD/USD Price Analysis: Gyrates near six-week-old ascending channel resistance
- NZD/USD fails to extend recovery from 0.6614 well beyond 0.6700.
- Bullish MACD, price-positive chart pattern keeps buyers hopeful.
- 100-day EMA adds strength to the channel support.
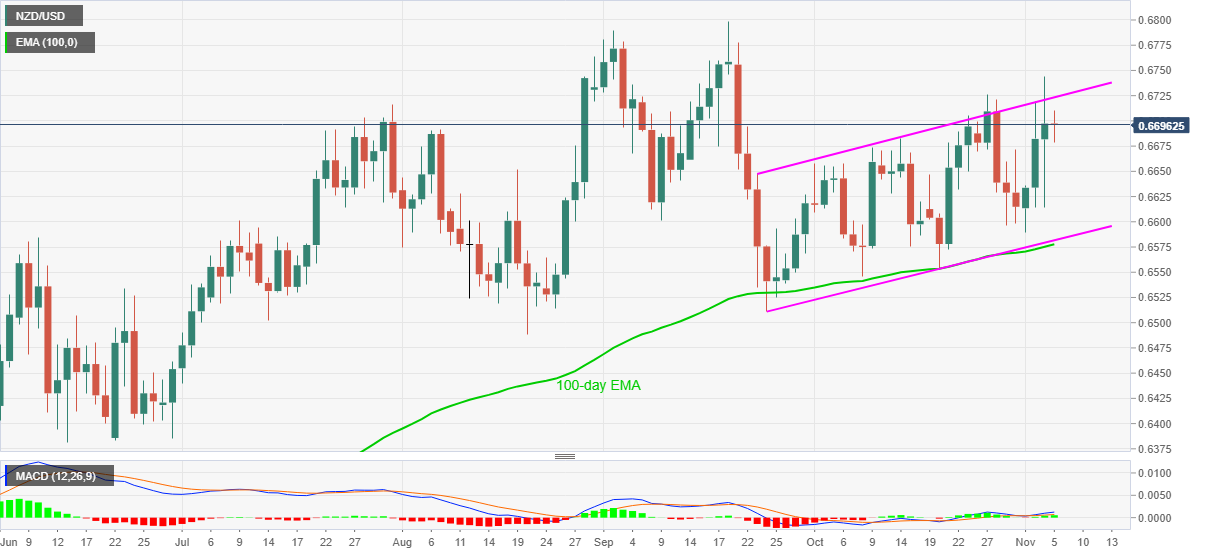
Having marked another failure to cross 0.6710, NZD/USD eases to 0.6692, down 0.05% intraday, ahead of Thursday’s European session. Even so, the pair stays inside a bullish chart pattern, ascending trend channel, amid upbeat MACD signals.
While 0.6710 restricts the quote’s immediate upside, the resistance line of the state channel stretched from September 23, at 0.6723 now, also challenges the NZD/USD bulls.
It should, however, be noted that the pair’s ability to cross 0.6723 on the daily closing needs validation from 0.6780 before looking to September’s peak surrounding the 0.6800 threshold.
Meanwhile, 0.6655/50 can offer immediate rest to the NZD/USD sellers ahead of dragging them to the 0.6600 round-figure support.
However, any further downside past-0.6600 will be limited by 100-day EMA and the mentioned channel’s support line around 0.6580/75.
NZD/USD daily chart
Trend: Bullish