AUD/USD Price Analysis: Key SMAs test bullish commitments below 0.7700
- AUD/USD fades Friday’s upside momentum while easing from intraday high.
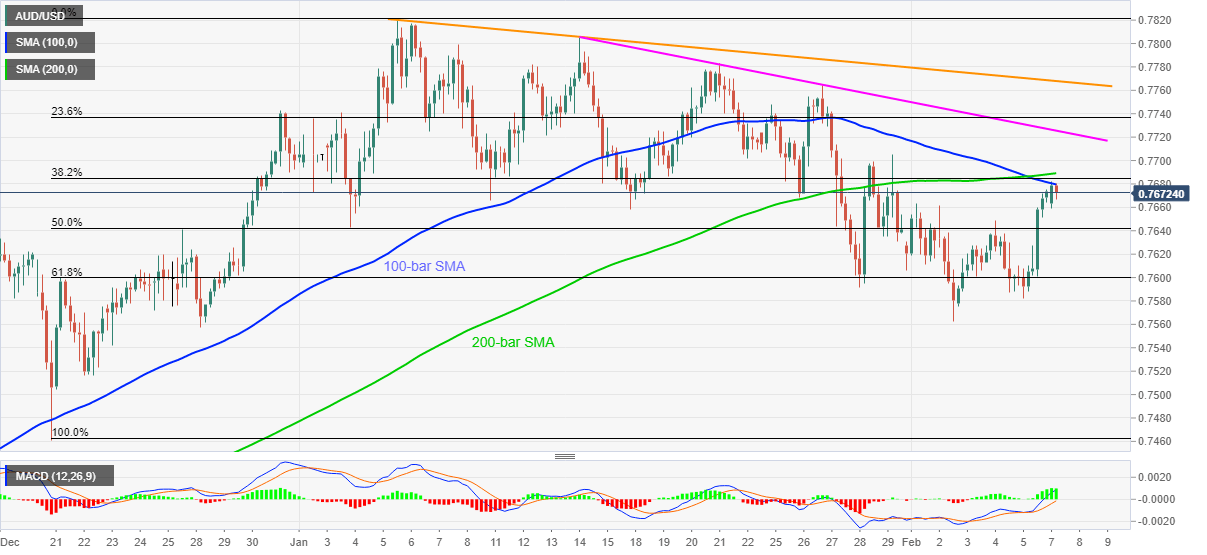
- Bullish MACD, recovery above 50% and 61.8% Fibonacci retracement levels favor buyers.
- Multiple trend line from January raise bars for the bulls’ entry.
Following its pullback from an intraday high of 0.7681, AUD/USD seesaws around 0.7670 during early Monday. As a result, the 100-bar SMA emerges as a strong immediate resistance that reversed early Asian gains.
Not only the 100-bar SMA level of 0.7680 but 200-bar SMA near 0.7690 also acts as a strong hurdle to cheer bullish MACD.
Should the quote manages to cross 0.7690, a downward sloping trend line from January 14, at 0.7725 now, followed by a one-month-old resistance line near 0.7770 lure the AUD/USD buyers.
In a case where the AUD/USD bulls dominate past-0.7770, January’s top near 0.7820, also the highest since early 2018, will be in the spotlight.
On the flip side, 50% and 61.8% Fibonacci retracement of the pair’s December 21 to January 06 upside, respectively near 0.7640 and the 0.7600 round-figure, will lure the AUD/USD sellers during further weakness.
Overall, the AUD/USD prices are firmer but need to cross tough resistances to convince the buyers.
AUD/USD four-hour chart
Trend: Bullish