Gold Price Analysis: XAU/USD bulls challenge 100-SMA after triangle breakout
- XAU/USD confirms symmetrical triangle breakout on the 4H chart.
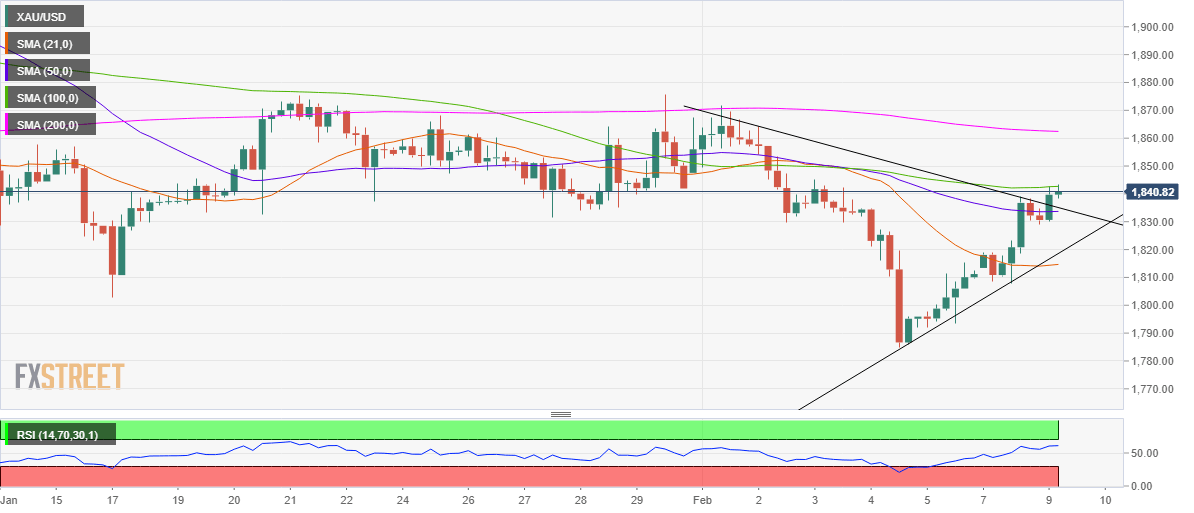
- Acceptance above 100-SMA is critical to unleashing further upside.
- 200-SMA at $1863 is the next upside target amid bullish RSI.
Gold (XAU/USD) has caught a fresh bid-wave in early Europe following a brief consolidation, as the bulls look to conquer $1850, as the recovery from two-month lows gathers steam.
Broad-based US dollar weakness amid the revival of the reflation trades on increased prospects of the US $1.9 trillion stimulus package, continues to favor the XAU bulls. Gold is considered a hedge against inflation and currency debasement.
From a short-term technical perspective, gold’s outlook appears constructive after a symmetrical triangle breakout was confirmed on the four-hour chart.
Despite the upside break, the gold bulls need to find acceptance above the horizontal 100-simple moving average (SMA) at $1843.
Gold prices are likely to see a sharp rise towards the 200-SMA of $1863 on a sustained move above the powerful 100-HMA barrier.
The relative strength index (RSI) points north above the 50.00 level, suggesting that the bullish bias remains intact.
Alternatively, strong support near $1835 could limit any pullbacks. That level is the confluence of the triangle resistance now support and 50-SMA.
Sellers would then gear up for a drop towards $1818, the pattern support.
Gold Price Chart: Four-hour chart
Gold Additional levels