Silver Price Analysis: XAG/USD remains trapped between two key averages
- Silver attempts a recovery but awaits fresh impetus for the next direction.
- XAG/USD wavers between 50 and 21-day SMAs.
- Daily RSI stays flat at midline, suggesting a lack of clear direction.
Silver (XAG/USD) reverses half the Friday slide, although remains below the $27 mark, as the bulls seem to lack follow-through upside bias.
The bears are fighting hard to regain control after last week’s $2 sell-off from $28.20 levels, with no clear direction in sight, as the tug-of-war looks to extend in the session ahead.
Silver Price Chart: Daily
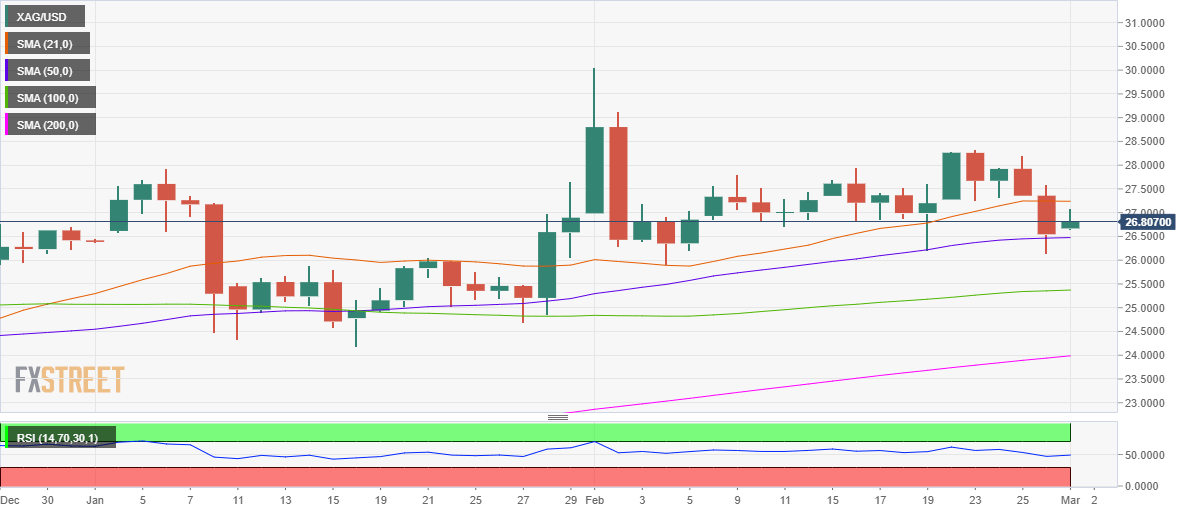
The white metal has managed to recapture the critical 50-day simple moving average (SMA) at $26.47 but the recovery remains capped below the 21-day SMA at $27. 24.
The XAG bulls need a firm break above the 21-day SMA barrier to extend the recovery from three-week troughs of $26.14 reached last Friday.
The next critical barrier is aligned at the psychological $27.50 mark.
Alternatively, should the 50-day SMA cushion give way once again, the multi-week lows could be retested.
Further south, the 100-day SMA support at $25.37 could come into play.
The 14-day Relative Strength Index (RSI) trades at the midline, suggesting a lack of clear directional bias,
Silver Additional levels