EUR/GBP Price Analysis: Bulls face challenges approaching 0.8700
- EUR/GBP remains sideways in the early European session.
- Bulls remain defensive near daily highs.
- Receding momentum oscillator signifies downside momentum.
EUR/GBP edges lower while moving in a narrow trade range in the early European session. The cross peaked at 0.8695 before reaching the intraday lows of 0.8680.
At the time of writing, EUR/GBP is trading at 0.8684, down 0.04% on the day.
EUR/GBP 4-hour chart
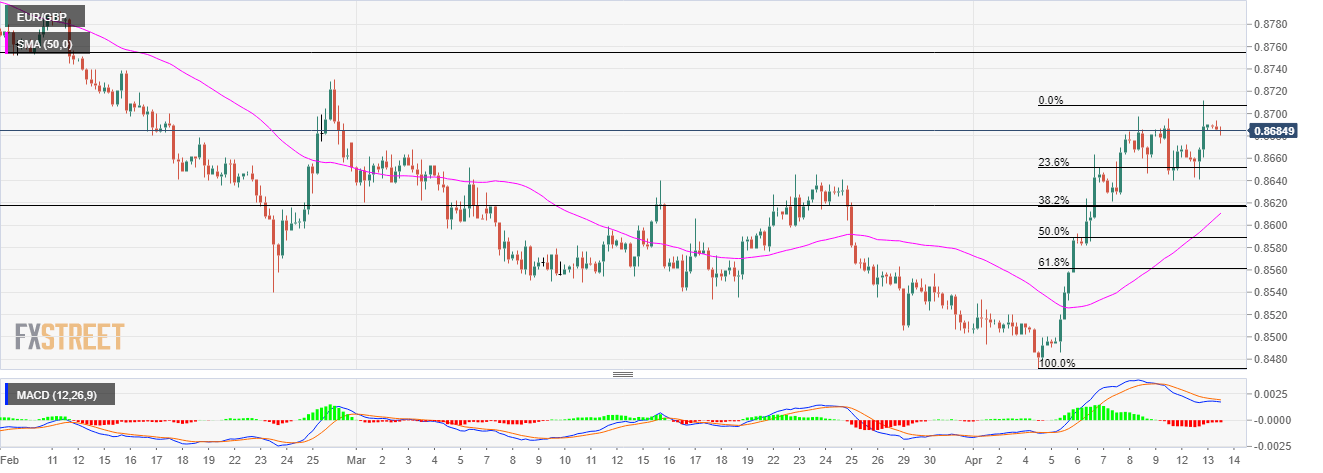
On the 4-hour chart, the cross has been trading with a negative bias, albeit in a narrow trade band, and is accommodating about 15 pips of movement. The large swing candlestick on Tuesday was followed by several Dojis near the higher levels, which signify pullback in the prices.
After making a bearish crossover, the Moving Average Convergence Divergence (MACD) indicator is now receding toward the midline, which is confirming the negative undertone in the prices. On moving down, bears could test the 23.6% Fibo. retracement level placed at 0.8650 and 0.8620 a horizontal support zone. A sustained move below the 50-hour SMA, placed at 0.8610, would test the lows of April 7 in the vicinity of 0.8580.
On the flip side, if the price breached the 0.8700 level, it will cheer up bulls toward the highs of February 26 near 0.8730. This would open the gates for further gains near the 0.8750 horizontal resistance zone and the highs of February 12 near the 0.8790 neighborhood.