GBP/USD Price Analysis: Bears have the upper hand near one-month lows
- GBP/USD dropped to near one-month lows on Thursday amid sustained USD strength.
- The technical set-up favours bearish traders and supports prospects for further weakness.
- Extremely oversold RSI on hourly charts warrants caution for aggressive bearish traders.
The GBP/USD pair maintained its heavily offered tone through the early North American session and was last seen trading around the 1.3675-70 region, or the lowest level since July 21.
The prevalent risk-off mood, along with expectations that the Fed will begin tapering its asset purchases later this year pushed the US dollar to nine-month tops on Thursday. This was seen as a key factor that continued exerting downward pressure on the GBP/USD pair.
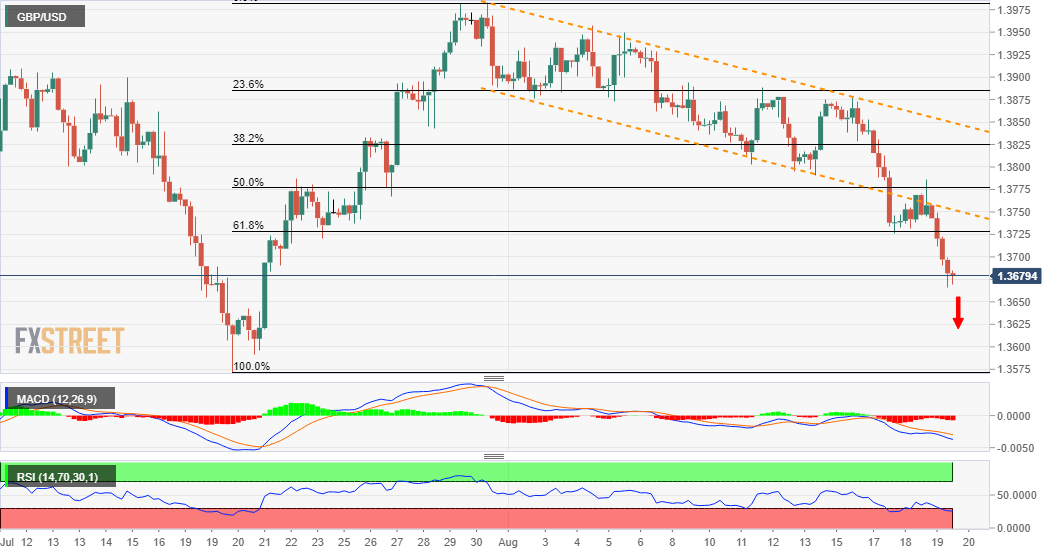
From a technical perspective, sustained weakness below the 1.3725 region – marking the 61.8% Fibonacci level of the 1.3572-1.3984 recent move up – was seen as a trigger for bearish traders. A subsequent fall below the 1.3700 mark further aggravated the intraday selling pressure.
This comes on the back of this week's decisive breakthrough the 1.3775 confluence support and might have already set the stage for an extension of the depreciating move. The mentioned region comprised 50% Fibo. level, 200-day SMA and the lower end of a descending channel.
The negative outlook is reinforced by the fact that oscillators on the daily chart are holding deep in the bearish territory and are still far from being in the oversold zone. That said, RSI on hourly charts is flashing extremely overstretched conditions and warrants some caution.
Nevertheless, the GBP/USD pair still seems vulnerable to prolong the downward trajectory towards testing the July daily closing lows support near the 1.3625-20 region. The next relevant support is pegged near the 1.3600 mark ahead of multi-month lows, around the 1.3570 area.
On the flip side, any meaningful recovery attempt might now be seen as an opportunity to initiate fresh bearish positions near the 1.3700 mark. This, in turn, should cap the upside for the GBP/USD pair near the 61.8% Fibo. level support breakpoint, around the 1.3725 region.
GBP/USD 4-hour chart
Technical levels to watch