AUD/USD Price Analysis: Bulls turn cautious near 61.8% Fibo./descending trend-line confluence
- COVID-19 jitters failed to assist AUD/USD to capitalize on Friday’s strong move up.
- Mixed technical indicators warrant some caution before placing fresh directional bets.
The AUD/USD pair struggled to capitalize on Friday's strong move up and witnessed a modest pullback from the 0.7315-20 area, or near two-week tops set on the first day of a new week.
The worsening COVID-19 situation in Australia turned out to be the only factor that acted as a headwind for the AUD/USD pair. That said, a subdued US dollar price action, along with the underlying bullish sentiment helped limit any meaningful slide for the perceived riskier aussie.
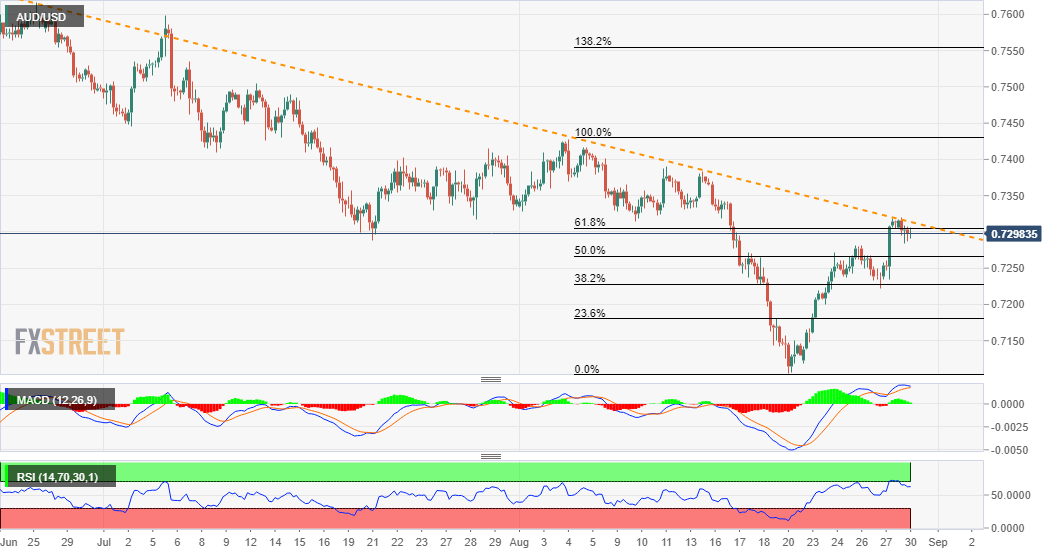
From a technical perspective, the recent bounce from the vicinity of the 0.7100 mark stalled near a resistance marked by the 61.8% Fibonacci level of the 0.7427-0.7106 decline. This coincides with a short-term descending trend-line and should now act as a key pivotal point for traders.
Meanwhile, technical indicators on hourly charts maintained their bullish bias and support prospects for the emergence of some dip-buying. However, oscillators on the daily chart – though have recovered from the negative territory – are yet to confirm a near-term positive outlook.
This makes it prudent to wait for a sustained break through the 0.7315-20 confluence hurdle before positioning for any further appreciating move. The AUD/USD pair might then aim to surpass an intermediate resistance near the 0.7375-80 region and reclaim the 0.7400 round figure.
On the flip side, the 50% Fibo. level, around the 0.7270 area now seems to protect the immediate downside ahead of the 0.7230-25 region (38.2% Fibo. level). A convincing break below will shift the bias in favour of bearish traders and prompt some aggressive technical selling.
The AUD/USD pair might then turn vulnerable to break below the 0.7200 mark and accelerate the fall further towards the 23.6% Fibo. level, around the 0.7180 zone. The downward trajectory could further get extended back towards challenging YTD lows, around the 0.7100 mark.
AUD/USD 4-hour chart
Technical levels to watch