GBP/USD Price Analysis: Remains sidelined on the way to 1.3800
- GBP/USD seesaws inside a choppy range after stepping back from two-week top.
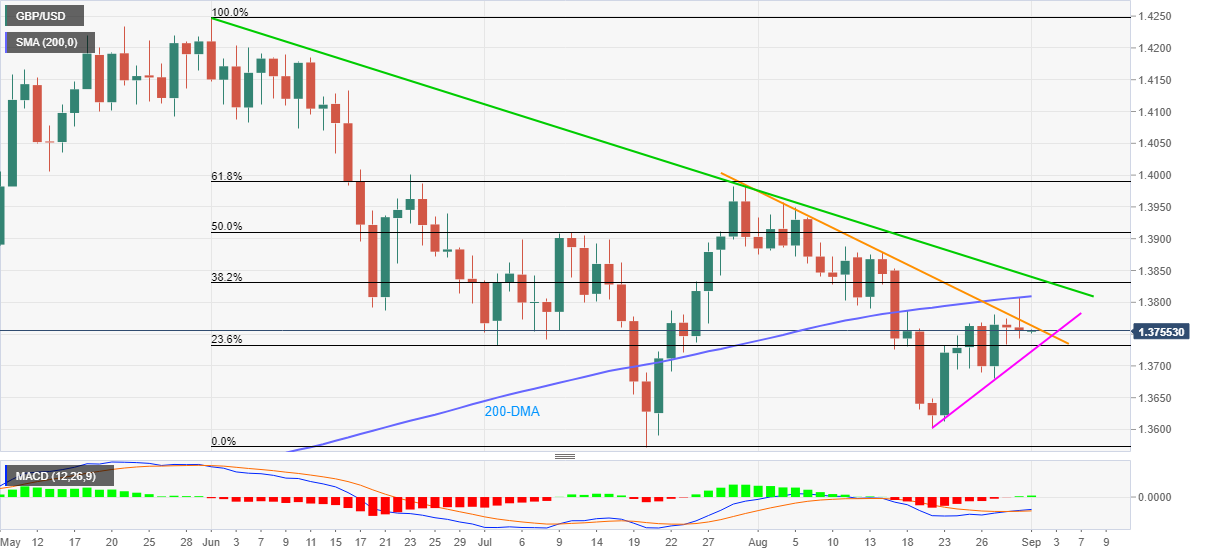
- Bullish MACD, weekly rising trend line keep buyers hopeful.
- Monthly resistance line, 200-DMA guard immediate upside, three-month-old resistance line becomes the key hurdle to the north.
GBP/USD begins September with bullish bias even as the quote seesaws around 1.3755 during early Wednesday morning in Asia.
The cable pair jumped to the highest since August 17 but stepped back from 200-DMA. However, the MACD flashes the strongest bullish signals in four weeks and an upward sloping trend line from August 20 also keeps buyers hopeful.
Prior to the 200-DMA level of 1.3810, a one-month-old downward sloping resistance line, near 1.3765, challenge the intraday bulls.
It should be noted that a clear upside break of 200-DMA won’t offer a free pass for the GBP/USD rally as a descending trend line from June 01, close to 1.3840, becomes a tough nut to crack for the bulls.
Alternatively, the stated weekly support line, around 1.3720 restricts the quote’s immediate downside ahead of directing the quote to August month’s low of 1.3600.
In a case where GBP/USD bears remain dominant past 1.3600, July’s bottom surrounding 1.3570 will be the key to watch.
GBP/USD: Daily chart
Trend: Further upside expected