Silver Price Analysis: XAG/USD consolidates near multi-week tops, holds above $24.00
- Silver struggled to capitalize on the previous day’s goodish move up to multi-week tops.
- Mixed technical indicators on hourly/daily charts held bulls from placing aggressive bets.
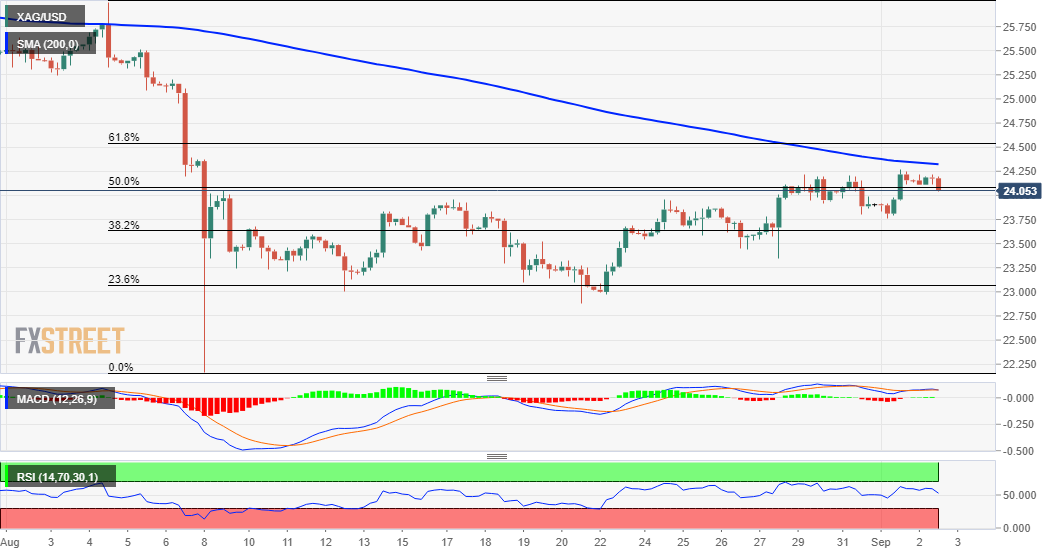
Silver witnessed a subdued/range-bound price action on Thursday and consolidated the previous day's strong move up to over three-week tops. The white metal now seems to have formed a strong base near the $24.00 mark, which coincides with the 50% Fibonacci level of the $26.00-$22.17 downfall.
Meanwhile, the upside remains capped near the $24.20-25 supply zone. This is followed by the 200-period SMA on the 4-hour chart, around the $24.35 region, and the 61.8% Fibo. level, near the $24.55 area. A sustained move beyond should pave the way for a further near-term appreciating move.
Meanwhile, technical indicators on hourly charts have been gaining positive traction, though are yet to confirm a bullish bias on the daily chart. This further makes it prudent to wait for a strong follow-through buying beyond the mentioned barriers before placing aggressive bullish bets.
A sustained breakthrough will be seen as a fresh trigger for bullish traders and push the XAG/USD further towards reclaiming the key $25.00 psychological mark. The momentum could further get extended towards an intermediate hurdle near the $25.35-40 region, en-route the $25.80 supply zone.
On the flip side, the $23.85-80 zone horizontal resistance breakpoint now seems to protect the immediate downside. Some follow-through selling below the 38.2% Fibo. level, around the $23.60 region, could accelerate the slide further towards the 23.6% Fibo. level, around the $23.00 round figure.
Silver 4-hour chart
Technical levels to watch