USD/ZAR Price Analysis: Stalls five-day uptrend amid a bear cross
- USD/ZAR is off four-week highs, as tide seems to turn in favor of bears.
- A bear cross spotted on the daily sticks, as upside stalls below $15.
- RSI has reversed from higher levels, backing the pullback.
USD/ZAR is off the four-week highs of 14.82, as the bulls take a breather after the blistery five-day rally.
Despite the pullback, the spot holds well above the 50-Daily Moving Average (DMA) at 14.63. Although the bulls appear to be losing conviction after a bearish crossover was spotted on the said time frame on Friday.
The 21-DMA pierced through the 200-DMA from above, with the sellers taking note of the bear cross this Monday.
The 14-day Relative Strength Index (RSI) has also eased off from higher levels, now turning flat, backing the latest leg down in the pair.
However, the leading indicator still holds above the midline, suggesting that any retracement could be a good buying opportunity for the traders.
If the price breaches the 50-DMA support, then strong support at 14.53 could guard the downside. At that point, the 21 and 200-DMAs coincide.
Further, a drop towards the horizontal 100-DMA at 14.33 cannot be ruled out.
USD/ZAR daily chart
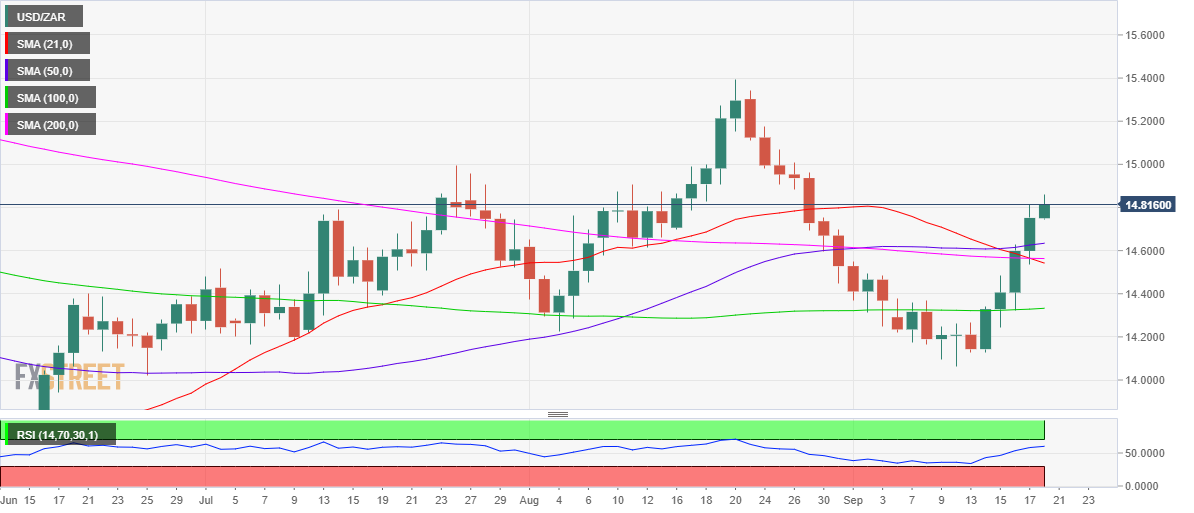
Alternatively, daily closing above the 15.00 level is needed to unleash the further upside towards the August highs of 15.39.
The next relevant upside barrier for USD/ZAR is seen at 15.50, the psychological barrier.