Gold Price Forecast: XAU/USD braces for a drop to $1738 support – Confluence Detector
- Gold price remains sold-off into heavy USD demand, higher Treasury yields.
- The risk-off mood remains at full steam amid the energy crisis, growth concerns.
- Gold appears ‘sell on bounce’ ahead of all-important NFP
The risk-off market profile continues to drive the safe-haven flows into the US dollar, weighing heavily on gold price. Escalating energy crisis-driven global economic growth concerns dampens the investors’ sentiment. Persistent uncertainty over the US debt ceiling also adds to the downbeat tone. Collaborating with the downside in gold price, the US Treasury yields continue to march higher on the expectations of rising inflation and sooner than expected Fed’s tapering. Attention now turns towards the US jobs data for the next direction in gold price.
Read: Gold Price Forecast: Why XAU/USD looks vulnerable below $1750? US ADP in focus
Gold Price: Key levels to watch
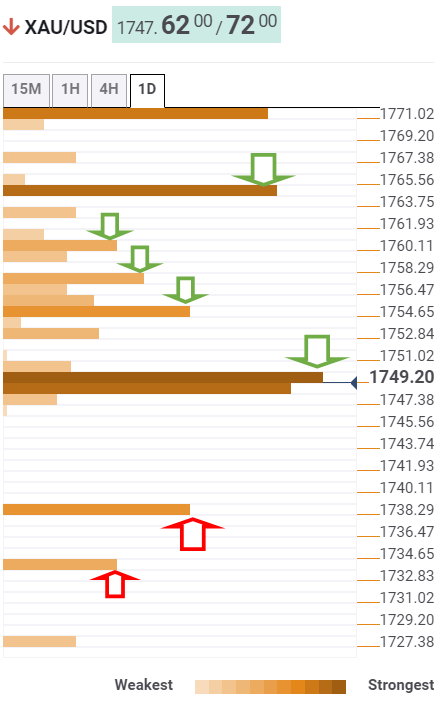
According to the Technical Confluences Detector, gold has convincingly breached the crucial support around $1748/ $1749, where the previous day’s low, pivot point one-day S1, Fibonacci 23.6% one-month and Fibonacci 38.2% one-week intersect.
Acceptance below the latter has opened floors for a steep drop towards the next downside target at $1738, the confluence of the Fibonacci 61.8% one-week and pivot point one-day S2.
If the bearish momentum picks up pace, then gold sellers will aim for the pivot point one-week S1 at $1733.
On the flip side, gold bulls will need to find their feet above the aforesaid critical support now resistance at $1749.
The next relevant resistance will be aligned at the convergence of the Fibonacci 23.6% one-day and one-week at $1754.
Further up, the Fibonacci 38.2% one-day at $1758 could challenge the bearish commitment on the road to recovery.
The SMA100 four-hour at $1760 could offer minor resistance, above which powerful barrier emerges at $1764, which will be the level to beat for gold bulls.
At that point, the previous week’s high merges with the Fibonacci 38.2% one-month.
Here is how it looks on the tool
About Technical Confluences Detector
The TCD (Technical Confluences Detector) is a tool to locate and point out those price levels where there is a congestion of indicators, moving averages, Fibonacci levels, Pivot Points, etc. If you are a short-term trader, you will find entry points for counter-trend strategies and hunt a few points at a time. If you are a medium-to-long-term trader, this tool will allow you to know in advance the price levels where a medium-to-long-term trend may stop and rest, where to unwind positions, or where to increase your position size.