GBP/USD Price Analysis: Climbs to fresh session tops, around 1.3635-40 region
- GBP/USD regained positive traction on Wednesday amid a modest USD profit-taking slide.
- Mixed technical indicators on hourly/daily charts warrant caution for aggressive traders.
- Investors might wait for a fresh trigger from the US CPI report and FOMC meeting minutes.
The GBP/USD pair built on its steady intraday ascent through the first half of the European session and climbed to fresh daily tops, around the 1.3635-40 region in the last hour. The pair, for now, seems to have snapped two successive days of the losing streak and was supported by a modest US dollar pullback from one-year tops.
The ongoing retracement slide in the US Treasury bond yields prompted some USD profit-taking ahead of Wednesday's release of the US consumer inflation figures. This, along with the FOMC minutes, will be looked at to gauge the Fed's path on normalizing monetary policy and influence the near-term USD price dynamics.
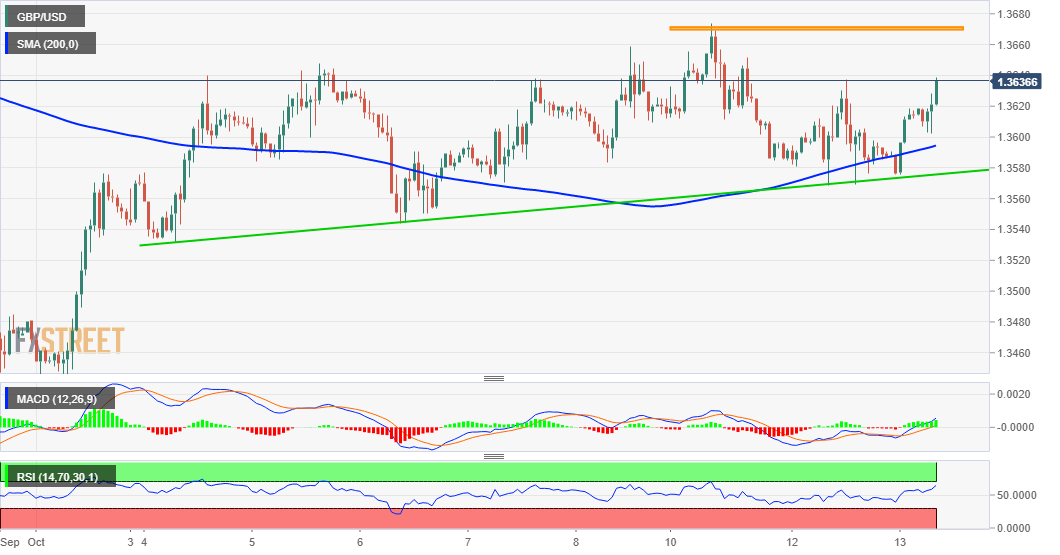
From a technical perspective, the GBP/USD pair stalled this week's retracement slide from the 1.3670-75 region and found a decent support near the 1.3570-65 confluence on Tuesday. The latter comprised of 200-hour SMA and over one-week-old ascending trend-line, which should now act as a pivotal point for short-term traders.
Meanwhile, the subsequent positive move supports prospects for additional intraday gains. The outlook is reinforced by the fact that oscillators on hourly charts have been gaining positive traction. That said, technical indicators on the daily chart are yet to confirm a bullish bias, warranting caution for aggressive traders.
Heading into Wednesday's key data/event risks, the GBP/USD pair is more likely to confront resistance near weekly swing highs, around the 1.3670-75 region. Some follow-through buying, leading to a move beyond the 1.3700 mark, will be seen as a fresh trigger for bullish traders and set the stage for a further appreciating move.
The GBP/USD pair might then surpass an intermediate hurdle near the 1.3720-25 region and aim to test the next relevant barrier near mid-1.3700s.
On the flip side, the 1.3600 round-figure mark (nearly 200-hour SMA) now seems to protect the immediate downside ahead of the trend-line support, currently near the 1.3575 region. A convincing break below could trigger some technical selling and turn the GBP/USD pair vulnerable to challenge the key 1.3500 psychological mark.
GBP/USD 1-hour chart
Technical levels to watch