USD/TRY Price Analysis: Bulls need validation from $9.7400
- USD/TRY seesaws inside three-week-old symmetrical triangle, probes two-day downtrend.
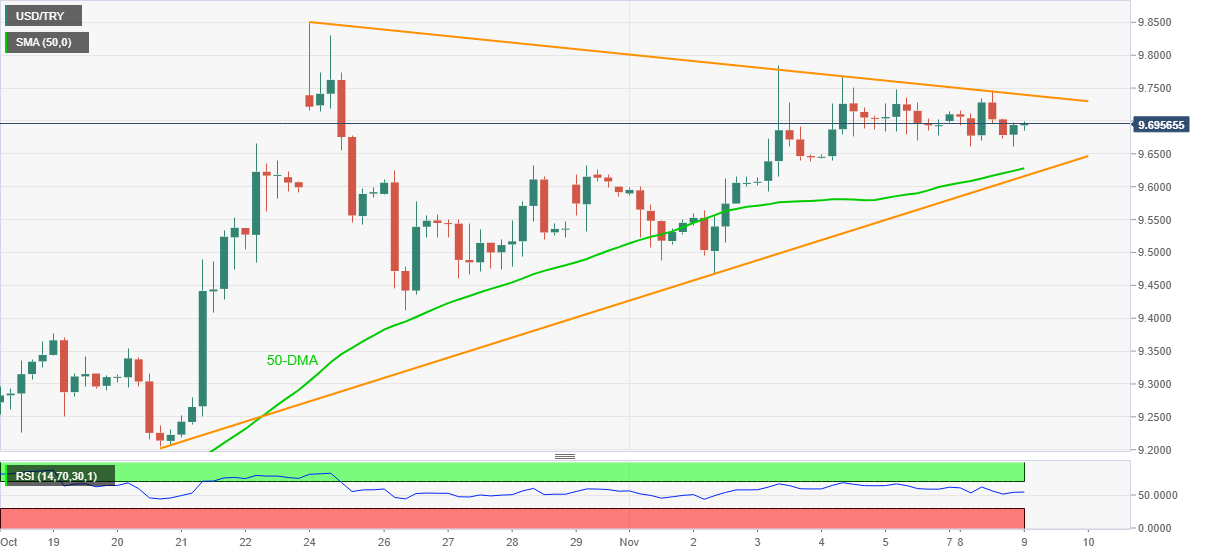
- Steady RSI, sustained trading above 50-SMA keeps buyers hopeful.
USD/TRY prints mild gains around $9.6955 during early Tuesday, mostly steady after declining in the last two days.
Even so, the Turkish Lira (TRY) pair remains inside a short-term symmetrical triangle formation amid a steady RSI line, which in turn suggests further grinding of the prices.
It should be noted, though, that the pair’s successful trading beyond 50-SMA favor buyers to overcome the immediate hurdle, namely the resistance line of the triangle’s resistance near $9.7400.
Following that, the monthly high near $9.7850 will be in focus before fueling the quote towards the record top of $9.8505 flashed in October.
Alternatively, 50-SMA and the stated triangle’s support, respectively around $9.6280 and $9.6160, restrict short-term pullback of the USD/TRY prices.
Should the quote drop past $9.6160, the monthly low of $9.4670 and $9.4100 should lure the bulls.
To sum up, USD/TRY grinds higher around the record top, seeking a trigger for the fresh run-up.
USD/TRY: Four-hour chart
Trend: Further upside expected