USD/CAD Price Analysis: Bulls retain control near multi-week tops, above mid-1.2500s
- A combination of factors pushed USD/CAD higher for the second successive day on Thursday.
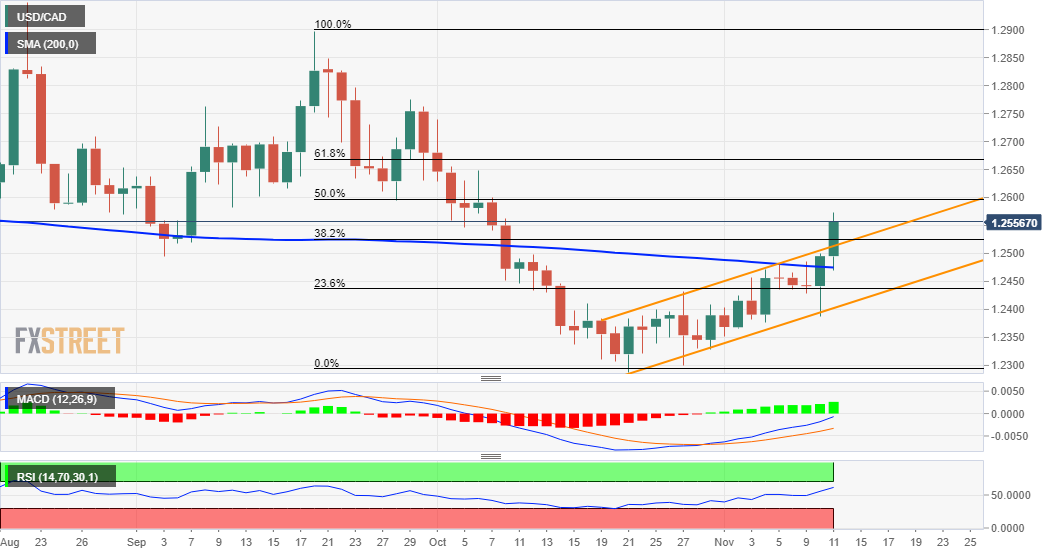
- Move beyond the 200-DMA, the 1.2500 mark and ascending channel resistance favours bulls.
- Overbought RSI on hourly charts seemed to be the only factor that capped gains for the major.
The USD/CAD pair built on the previous day's US CPI-inspired rally of over 115 pips from sub-1.2400 levels and gained strong follow-through traction on Thursday. This marked the second successive day of a strong positive move and pushed the pair to five-week tops, around the 1.2570-75 region during the mid-European session.
The US consumer prices in October rose at the fastest annual pace since 1990 and raised bets that the Fed would adopt a more aggressive policy response to contain rising inflationary pressures. This, in turn, pushed the US Dollar Index to the highest level since July 2020 and acted as a tailwind for the USD/CAD pair.
On the other hand, sliding crude oil prices undermined the commodity-linked loonie and provided an additional boost to the major. Apart from this, technical buying on a sustained strength beyond the very important 200-day SMA and the key 1.2500 psychological mark further contributed to the ongoing positive momentum.
Meanwhile, the latest leg up confirmed a near-term bullish breakout through a three-week-old ascending channel and might have already set the stage for additional gains. That said, RSI on hourly charts are flashing overbought conditions and warrants some caution before placing fresh bullish bets around the USD/CAD pair.
Investors might also refrain from placing aggressive bets amid relatively thin liquidity conditions on the back of a bank holiday in the US and Canada. That said, oscillators on the daily chart have just started gaining positive traction and are still far from being in the overstretched territory, adding credence to the positive bias.
Nevertheless, the USD/CAD pair seems poised to reclaim the 1.2600 round-figure mark. The mentioned handle coincides with the 50% Fibonacci level of the 1.2896-1.2288 recent leg down, which should now act as a key pivotal point for traders. Some follow-through buying should pave the way for a further near-term appreciating move.
The upward trajectory could further get extended towards the 61.8% Fibo. level, around the 1.2665-70 region, above which bulls are likely to aim to reclaim the 1.2700 round-figure mark.
On the flip side, the ascending channel breakpoint, which coincides with the 38.2% Fibo. level, around the 1.2525 region, now seems to protect the immediate downside. Any further slide could be seen as a buying opportunity near the 1.2500 mark, which should help limit the pullback near 200-DMA support, currently near the 1.2480-5 region.
USD/CAD daily chart
Technical levels to watch