Gold Price Forecast: XAU/USD trades in a familiar range below 200/100-DMA, US CPI awaited
- A softer risk tone assisted the safe-haven gold to regain positive traction on Friday.
- A subdued USD price action did little to provide any meaningful impetus to the metal.
- Hawkish Fed expectations should cap the upside ahead of the US consumer inflation.
Gold attracted some buying during the Asian session on Friday and recovered a part of the previous day's slide back closer to the weekly low. Mixed headlines on the Omicron variant of the coronavirus kept a lid on the recent optimism, which was evident from a softer tone around the equity markets. This, in turn, was seen as a key factor that assisted the safe-haven XAU/USD to regain some positive traction.
Meanwhile, the US dollar struggled to capitalize on the previous day's positive move and witnessed a subdued/range-bound price action on the last day of the week. This further acted as a tailwind for the dollar-denominated commodity, though the uptick lacked bullish conviction. Expectations that rising inflationary pressure would force the Fed to tighten its monetary policy sooner rather than later capped gains for the non-yielding gold.
Moreover, investors also seemed reluctant, rather preferred to move on the sidelines ahead of the US consumer inflation figures, due for release later during the early North American session. The US CPI report would influence the Fed's decision to taper its stimulus at a faster pace and its strategy on interest rate hikes. This will influence the USD demand and provide a fresh impetus to gold prices heading into the FOMC policy meeting on December 14-15.
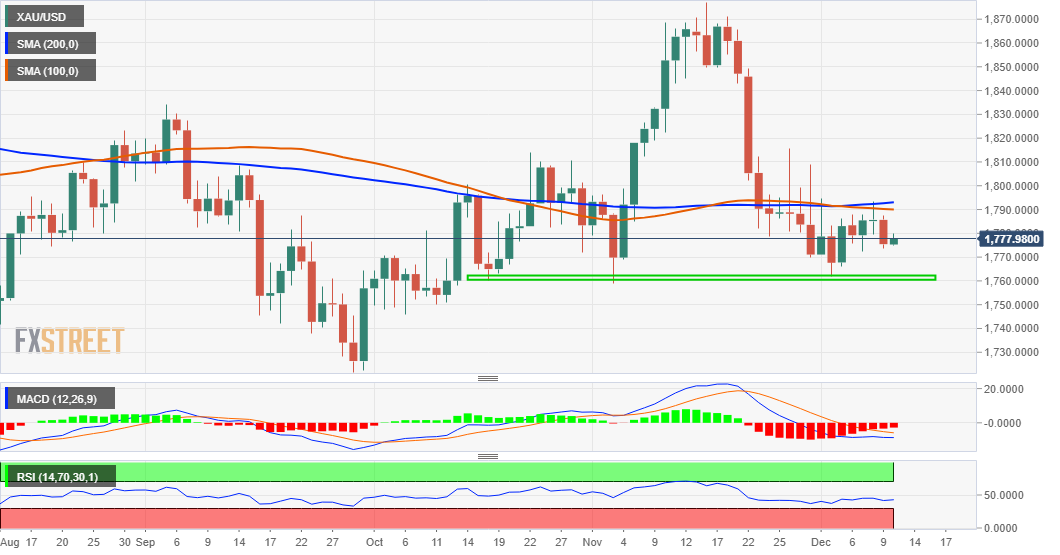
Technical outlook
From a technical perspective, gold has been oscillating in a familiar trading band over the past two weeks or so. Given the recent sharp pullback from a multi-month high, around the $1,877 region, the range-bound price action could still be categorized as a bearish consolidation phase. The negative outlook is reinforced by the fact that spot prices have repeatedly failed to clear/find acceptance above a technically significant 200-day SMA. This, in turn, suggest that the near-term bias remains tilted firmly in favour of bearish traders.
That said, it will still be prudent to wait for a convincing break through the $1,773-72 area before positioning for a slide back towards testing the monthly swing low, around the $1,762 region. Some follow-through selling below the $1,759-58 zone will confirm a fresh bearish breakdown and drag gold prices further towards the next relevant support near the $1,750 level.
On the flip side, any subsequent move up might continue to confront stiff resistance near the $1,792-93 region (200-DMA). The mentioned barrier coincides with 100-day SMA and is closely followed by the $1,800 round-figure mark. A sustained strength beyond has the potential to lift spot prices to the next relevant resistance near the $1,810-15 supply zone en-route the $1,832-34 horizontal barrier. The latter should act as a key pivotal point for short-term traders.
Gold daily chart
Key levels to watch